Penerangan
StructureSniper (Struktur Pasaran BOS/CHoCH)
StructureSniper – penunjuk yang membaca struktur pasaran untuk anda.
StructureSniper adalah penunjuk cTrader lanjutan yang secara automatik mengesan struktur pasaran, menandakan:
- utama puncak ayunan / dasar ayunan,
- Pecahan Struktur (BOS):
-
- BOS↑ apabila harga ditutup di atas puncak ayunan terakhir,
- BOS↓ apabila harga ditutup di bawah dasar ayunan terakhir,
- Perubahan Watak (CHoCH):
-
- CH↑ = BOS bullish pertama selepas persekitaran bearish,
- CH↓ = BOS bearish pertama selepas persekitaran bullish.
Ia menunjukkan kepada anda bila struktur benar-benar berubah, tanpa lukisan manual dan tanpa tekaan subjektif.
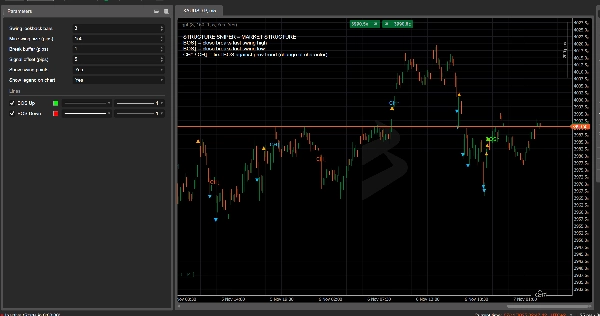
Apa yang dipaparkan pada carta
- ▲ puncak ayunan (oren): puncak tempatan penting
- ▼ dasar ayunan (biru): dasar tempatan penting
- BOS↑ (limau) di bawah lilin yang memecahkan puncak ayunan terakhir
- BOS↓ (merah) di atas lilin yang memecahkan dasar ayunan terakhir
- CH↑ (biru) pada BOS bullish pertama yang membalikkan trend
- CH↓ (merah/oren) pada BOS bearish pertama yang membalikkan trend
Sesuai untuk pedagang yang menggunakan:
- Konsep Smart Money / ICT / Wyckoff,
- perdagangan berasaskan struktur (HH/HL, LH/LL),
- BOS + setup sambungan retest atau CHoCH sebagai isyarat pembalikan sebenar.
Parameter penunjuk (v2)
1. Bar pandangan semula ayunan
Berapa banyak bar untuk dilihat ke belakang untuk menentukan ayunan.
- Default:
3 - Nilai lebih tinggi → ayunan yang lebih sedikit dan lebih signifikan
- Nilai lebih rendah → lebih banyak ayunan, struktur lebih terperinci
2. Saiz ayunan minimum (pips)
Menapis ayunan kecil (bunyi).
- Default:
2.0 0= terima semua ayunan- Nilai lebih tinggi → hanya simpan ayunan dengan jarak minimum dari puncak/dasar tempatan
3. Penampan pecahan (pips)
Berapa banyak penutupan mesti memecahkan ayunan untuk dikira sebagai BOS sebenar.
- Default:
1.0 - Membantu mengelakkan BOS palsu pada lonjakan kecil
4. Offset isyarat (pips)
Jarak (dalam pips) untuk meletakkan label BOS/CH jauh dari puncak/dasar lilin.
- Hanya kosmetik – tingkatkan jika label terlalu dekat dengan harga.
5. Tunjukkan titik ayunan
- benar = tunjukkan ▲ / ▼ pada puncak/dasar ayunan
- palsu = sembunyikan penanda ayunan, hanya tunjuk BOS/CH untuk carta yang lebih kemas
6. Tunjukkan legenda pada carta
Menunjukkan legenda kecil di sudut kiri atas yang menerangkan BOS↑ / BOS↓ / CH↑ / CH↓.
Mengapa StructureSniper menonjol
- Objektif: peraturan nombor yang jelas dan bukannya lukisan struktur subjektif.
- Pendidikan: sangat baik untuk pembelajaran dan ujian semula visual konsep struktur pasaran ICT/SMC.
- Praktikal: membantu menentukan:
-
- trend semasa (naik / turun),
- zon pullback logik selepas BOS,
- tanda sebenar pertama pembalikan (CHoCH), bukan sekadar pantulan rawak.
🔗 Kombinasi Killa: digabungkan dengan Bounty Killer, anda boleh:
- gunakan lilin stop-hunt (Bounty Killer) untuk mencari kecairan,
- kemudian gunakan StructureSniper untuk mengesahkan sambungan atau pembalikan melalui BOS/CHoCH.
Ringkasan
Ulasan pelanggan
5 | 67 % | |
4 | 33 % | |
3 | 0 % | |
2 | 0 % | |
1 | 0 % |


![Logo "[Stellar Strategies] Inside Bar with Signals"](https://cdn.ctrader.com/image/webp/1d9e8bfa-3b2c-4440-bb37-5856902008a7_30683)


