
Penerangan
📌 Trend Penapis Kalman – Gambaran Keseluruhan & Ulasan
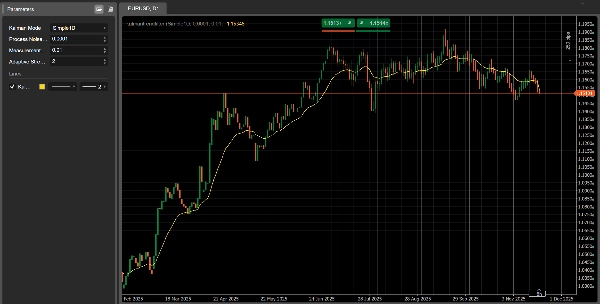
Trend Penapis Kalman adalah penunjuk mengikuti trend yang maju untuk cTrader, direka untuk memberikan garis trend yang lancar dan sangat responsif dengan kelewatan yang jauh lebih sedikit berbanding purata bergerak tradisional.
Di mana penapis SMA/EMA klasik bertindak balas perlahan dan sering terlepas perubahan trend awal, Penapis Kalman:
- Sentiasa mengemas kini anggarannya tentang harga “sebenar”
- Mengimbangi kelancaran dan kepekaan secara matematik
- Menyesuaikan diri dengan volatiliti (mod Adaptif)
- Memodelkan kedua-dua harga dan halaju (mod 2D)
Ini menjadikannya alat yang berkuasa untuk kedua-dua pedagang manual dan pembangun sistem automatik.
🎛 Mod & Parameter
Mod Kalman (3 Versi dalam Satu Penunjuk)
1️⃣ Simple1D
Penapis Kalman 1D klasik.
Pantas, bersih, dan sangat baik untuk pengesanan trend jangka pendek.
2️⃣ PositionVelocity2D
Memodelkan kedua-dua harga dan halaju trend.
Sesuai sebagai penapis arah dalam strategi algoritma.
3️⃣ Adaptive1D
Secara automatik menyesuaikan diri dengan volatiliti.
Lebih responsif dalam pasaran pantas, lebih lancar dalam keadaan tenang.
🧩 Penjelasan Parameter Utama
- Kebisingan Proses (Q):
Lebih tinggi = tindak balas trend lebih cepat, lebih rendah = garis lebih lancar. - Kebisingan Pengukuran (R):
Lebih tinggi = penapis kurang mempercayai data → hasil lebih lancar. - Kekuatan Adaptif:
Digunakan hanya dalam Adaptive1D. Mengawal sejauh mana volatiliti mempengaruhi penapis.
📈 Cara Mentafsir Isyarat
1. Mengesan Arah Trend
- Trend Naik: Garis condong ke atas, harga berada di atas penapis.
- Trend Turun: Garis condong ke bawah, harga berada di bawah penapis.
- Mendatar: Pasaran berada dalam julat, elakkan strategi pecah.
2. Isyarat Masuk (Logik Persilangan)
Masuk Bullish:
- Harga ditutup di atas garis Kalman
- Garis mula berputar ke atas
Masuk Bearish:
- Harga ditutup di bawah garis Kalman
- Garis mula berputar ke bawah
3. Kekuatan Trend (Mod 2D)
Cerun menjadi bacaan langsung momentum:
- Cerun ke atas yang kuat → trend bullish yang kuat
- Cerun ke bawah yang kuat → trend bearish yang kuat
- Cerun mendatar → trend melemah atau fasa peralihan
📊 Contoh Penggunaan Praktikal
✔ Strategi Mengikuti Trend
Gunakan Simple1D atau Adaptive1D:
- Beli di atas garis apabila cerun menjadi positif
- Jual di bawah garis apabila cerun menjadi negatif
✔ Pendekatan Multi-Timeframe
- Gunakan Kalman pada H1 untuk arah
- Gunakan Kalman pada M15 untuk kemasukan tepat
- Masuk hanya dalam arah yang ditunjukkan oleh timeframe lebih tinggi
✔ Integrasi Bot
Sesuai untuk perdagangan algoritma:
- Benarkan hanya panjang jika cerun > 0
- Benarkan hanya pendek jika cerun < 0
- Gunakan Adaptive1D untuk indeks volatil seperti US500, NAS100, US2000
🌟 Sertai Komuniti Kami
Jika anda mahu akses kepada:
- Pengoptimuman eksklusif untuk setiap bot kami
- Petua konfigurasi lanjutan
- Penambahbaikan perdagangan
- Bantuan teknikal yang diperibadikan
- Kemas kini dan alat baru
👉 Sertai komuniti kami dengan mengklik pautan di halaman profil saya.
Di sana anda akan menemui tetapan pengoptimuman terbaik untuk semua bot kami, dikemas kini secara berkala.
Ringkasan
Ulasan pelanggan
5 | 0 % | |
4 | 100 % | |
3 | 0 % | |
2 | 0 % | |
1 | 0 % |


![Logo "[CB] Pivot Points Pro"](https://cdn.ctrader.com/image/webp/43463c82-67b0-4f10-a4ba-901bba091d81_32594)


![Logo "[Hamster-Coder] Pivot Points MTF"](https://cdn.ctrader.com/image/webp/4c143e5a-309c-40e3-a578-f04d1e133ffa_31159)
