説明
📌 インジケーターの機能
MarketStructureOscSignals は 純粋なプライスアクションシグナルツールです。
それは:
- 左/右のルックバックを使って スイング高値とスイング安値を検出します。
- それらのスイングが形成されているかどうかを追跡します:
-
- 高値と安値が共に上昇 → 強気の構造
- 高値と安値が共に下降 → 弱気の構造
- 構造が 切り替わるとき:
-
- 弱気 → 強気 → 買いシグナルを表示します。
- 強気 → 弱気 → 売りシグナルを表示します。
したがって、すべてのシグナルは 市場構造の真の変化を表しており、単なる移動平均のクロスオーバーではありません。
⚙️ 入力と設定方法
1. Swing Left / Swing Right
これらはスイング高値/安値の「厳密さ」を制御します。
- Swing Left(デフォルト2)
スイングの左側にあるバーの数で、スイング高値の場合はより低い高値、スイング安値の場合はより高い安値でなければなりません。 - Swing Right(デフォルト2)
スイングを確認するために右側にあるバーの数。
使い方:
- 小さい値(1〜2):
-
- スイングが多く、シグナルも多い
- 高い時間足(H1、H4、D1)でよく機能します。
- 大きい値(3〜4以上):
-
- 主要な構造の転換のみ
- シグナルは少ないが強力
- ノイズを避けるために低い時間足で良い
2. Min Bars Between Signals
2つのシグナル間に経過しなければならない最小バー数。
- 小さなプルバックごとに矢印が 密集するのを防ぎます。
- 例:
-
- を
3に設定 → 1つのシグナルと次のシグナルの間に少なくとも3バー。 - 非常に速いチャート(M1〜M5)では
5〜10を推奨。 - H1以上では通常
2〜3で十分です。
- を
3. Arrow Offset (pips)
矢印とラベルがローソク足からどれだけ離れて配置されるか(ピップ単位)。
- FXの場合:
-
5〜10ピップが一般的に見栄えが良いです。
- インデックス(US500、US100など)の場合:
-
- より大きなオフセットを使用(例:ブローカーのピップサイズに応じて20〜50ピップ)。
矢印がローソク足と重なる場合は、この値を増やしてください。
遠すぎる場合は減らしてください。
4. Show BUY/SELL Text
true→ 矢印(↑/↓)と「BUY」または「SELL」のテキストを表示します。false→ 矢印のみ。
チャートがごちゃごちゃしている場合は、テキストを非表示にして矢印だけにできます。
🔍 シグナル生成の仕組み(ロジック)
インジケーター内部では:
- 最新の 2つのスイング高値 と 2つのスイング安値を追跡します:
-
_prevHigh、_lastHigh_prevLow、_lastLow
- これらから以下をチェックします:
-
- 高値と安値が 両方とも上昇しているか?
-
- → 強気トレンド(
StructureTrendSignal.Bullish)
- → 強気トレンド(
- 高値と安値が 両方とも下降しているか?
-
- → 弱気トレンド(
StructureTrendSignal.Bearish)
- → 弱気トレンド(
- 整合していない場合は、前のトレンドを維持します。
- 構造トレンドが変わるたびに:
-
弱気 → 強気→ 買いシグナル強気 → 弱気→ 売りシグナル
- また以下を確認します:
-
- トレンドが
Unknownでないこと(つまり最初ではない)。 - 最後のシグナルから十分なバー数が経過していること(
MinBarsBetweenSignals)。
- トレンドが
これは、各矢印が 真の構造変化を示しており、ランダムなノイズではないことを意味します。
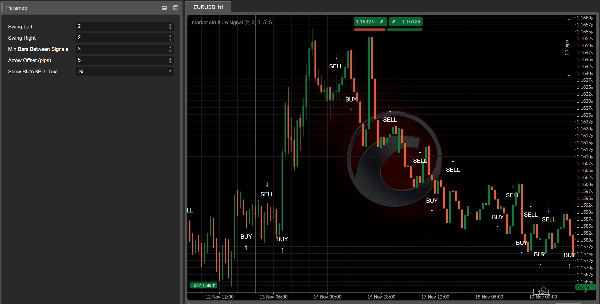
📈 チャート上の買い/売りシグナルの読み方
✅ 買いシグナル
見た目:
- ローソク足の下にある 上向き矢印
↑。 - オプションで矢印の近くに「BUY」のテキスト。
意味:
- 構造が 弱気 → 強気に変わった。
- 最近のスイング高値と安値が 両方とも上昇している。
- 市場は新しい上昇トレンドに移行するか、強気構造を再開している可能性が高い。
使い方:
- ロングエントリーを探す:
-
- シグナルローソク足またはその後の数本のローソク足で。
- できれば小さなプルバック後、サポートレベル(前のスイング安値、需要ゾーン、VWAP、VA安値など)で。
- Kalmanトレンド、EMA、ボリュームプロファイルなどのツールでフィルターする:
-
- 高い時間足やKalmanが強気の場合のみ買いを取る。
✅ 売りシグナル
見た目:
- ローソク足の上にある 下向き矢印
↓。 - オプションで「SELL」のテキスト。
意味:
- 構造が 強気 → 弱気に変わった。
- スイング高値と安値が 両方とも下降している。
- 市場は下降トレンドに入るか、弱気構造を再開している可能性が高い。
使い方:
- ショートエントリーを探す:
-
- シグナルローソク足または抵抗付近の次のローソク足で。
- 壊れたサポート(現在は抵抗)、VAH、供給ゾーンなどの再テスト後が理想的。
🎯 実用的なトレーディングの使い方
1. 単独のエントリーツールとして
シンプルなルールセット:
- 買いセットアップ
-
- 買い矢印を待つ。
- シグナルローソク足付近でロング注文を出す。
- 最近のスイング安値の下にストップロスを置く。
- 前のスイング高値または重要な抵抗をターゲットにする。
- 売りセットアップ
-
- 売り矢印を待つ。
- シグナルローソク足付近でショート注文を出す。
- 最近のスイング高値の上にストップロスを置く。
- 前のスイング安値または重要なサポートをターゲットにする。
これは最も基本的な使い方で、構造がより明確な H1、H4、D1で最適に機能します。
2. 他のインジケーターとの確認ツールとして
ここで強力になります。
🔹 カルマンフィルタートレンド
- 以下の場合のみ 買いシグナルを取る:
-
- カルマントレンドが 上向き傾斜で、価格がカルマンラインの上または付近にある。
- 以下の場合のみ 売りシグナルを取る:
-
- カルマントレンドが 下向き傾斜で、価格がカルマンラインの下または付近にある。
効果:
カルマンは 滑らかなトレンドを提供し、MarketStructureOscSignalsは 正確な構造変化を提供します。これらを組み合わせることで多くの悪いトレードをフィルターできます。
🔹 ボリュームプロファイル / サポート&レジスタンス
- 強い買い:
-
- 買い矢印が VA低値、前のスイング安値、または流動性スイープ付近に現れ、拒否がある。
- 強い売り:
-
- 売り矢印が VA高値、前のスイング高値、または流動性スイープの上部に現れる。
ここでのシグナルは単なるテクニカルパターンではなく、流動性と注文フローゾーンにも基づいています。
3. スケーリングイン/アウト用
新しいシグナルを以下のように使うこともできます:
- スケールインポイント
既存のトレードと同じ方向の新しいシグナルが現れ、かつ高い時間足が整合している場合にポジションを追加します。 - 早期退出 / 部分退出
ロングポジション中に 売りシグナルがポジションに逆らって現れた場合(特に重要な構造付近)、以下が可能です: -
- ポジションの一部をクローズする
- またはストップを引き締める
🧪 推奨開始設定
対象: FX H1 / H4:
Swing Left = 2Swing Right = 2Min Bars Between Signals = 3Arrow Offset = 5–10 pips
対象: インデックス M15 / H1:
Swing Left = 2–3Swing Right = 2–3Min Bars Between Signals = 5Arrow Offsetはシンボルに合わせて調整(例:ブローカーにより20〜50ピップ)
対象: 暗号通貨 H1 / H4:
- ノイズをフィルターするためにやや大きめのスイング:
-
Swing Left = 3Swing Right = 3Min Bars Between Signals = 4–6
常にお使いの銘柄と時間足でバックテストし、Swing と MinBarsBetweenSignalsを微調整してください。
概要
カスタマーレビュー
5 | 100 % | |
4 | 0 % | |
3 | 0 % | |
2 | 0 % | |
1 | 0 % |


