Penerangan
Analisis Isipadu Profesional dengan Pengiraan Delta Berasaskan Lilin Pintar
Buka kuasa analisis isipadu gred institusi dengan PROFIL ISIPADU LILIN DELTA BERANJAK, penunjuk profil isipadu beranjar paling maju untuk cTrader. Direka untuk pedagang serius yang menuntut pandangan pasaran yang tepat, penunjuk ini mendedahkan di mana aktiviti pasaran sebenar berlaku melalui pengiraan delta berasaskan lilin yang pintar.
🎯 CIRI-CIRI UTAMA
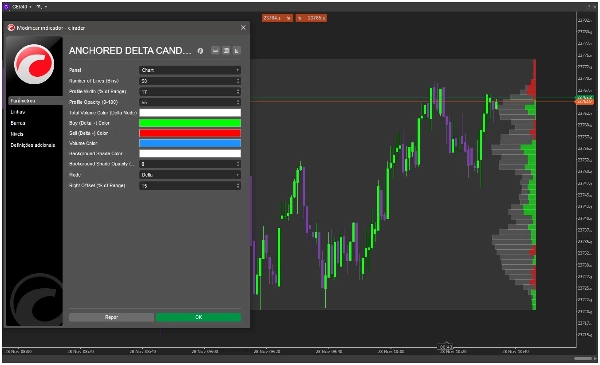
🏓 SISTEM PENJANGKARAN PINTAR
- Cuma lukis satu garis menegak di mana-mana pada carta anda
- Penjanaan profil automatik berjangkar pada titik pilihan anda
- Kemas kini dinamik apabila tindakan harga baru berkembang
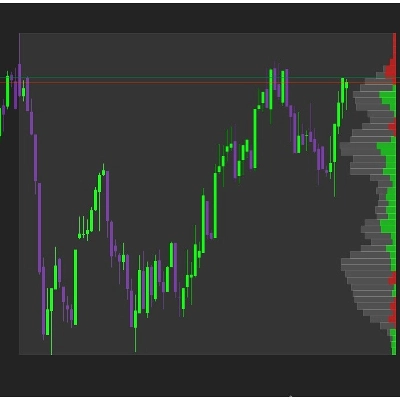
📊 DELTA BERASASKAN LILIN PINTAR
- Analisis delta maju berdasarkan arah lilin
- Lilin hijau = Isipadu Beli | Lilin merah = Isipadu Jual
- Visualisasi bersih, satu warna bagi setiap tahap harga
- Pengenalan segera zon tekanan beli/jual
🎨 REKA BENTUK VISUAL YANG BOLEH DISESUAIKAN
- Lebar profil boleh laras (5-100% daripada julat)
- Warna boleh disesuaikan untuk isipadu beli/jual/jumlah
- Kawalan ketelusan untuk integrasi carta yang sempurna
- Bayangan profesional untuk keterbacaan yang dipertingkatkan
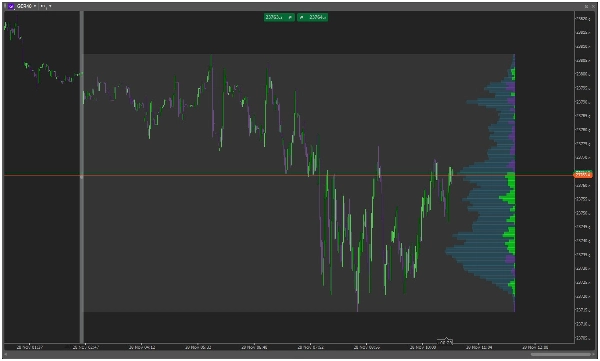
⚡ MOD PAPARAN FLEKSIBEL
- Mod Delta: Lihat tekanan beli/jual bersih pada setiap tahap harga
- Mod Isipadu: Paparan profil isipadu tradisional
- Berjangkar kanan untuk penggunaan ruang carta yang optimum
🚀 MENGAPA PEDAGANG MENYUKAINYA
"Akhirnya, profil isipadu yang benar-benar berfungsi! Pengiraan delta berasaskan lilin sangat tepat untuk mengenal pasti aktiviti institusi." - Pedagang Profesional
"Pengubah permainan untuk analisis profil pasaran saya. Sistem penjangkaran sangat cemerlang dan pendekatan berasaskan lilin sangat masuk akal." - Penganalisis Institusi
📈 SESUAI UNTUK
- Pedagang Profil Pasaran - Kenal pasti kawasan nilai dan paras tinggi/rendah yang lemah
- Ahli Teori Pasaran Lelongan - Fahami proses pembangunan pasaran
- Strategi Berasaskan Isipadu - Sahkan pecahan dengan pengesahan isipadu
- Analisis Aliran Institusi - Kenal pasti pengumpulan/pengagihan wang pintar
🛠 MUDAH DIGUNAKAN
- Lukis garis menegak di titik penjangkar anda
- Tonton semasa PROFIL ISIPADU LILIN DELTA BERANJAK menjana secara automatik
- Analisis taburan delta merentasi tahap harga
- Dagangan dengan keyakinan menggunakan tahap yang disahkan isipadu
🔧 SPESIFIKASI TEKNIKAL
- Pengiraan masa nyata
- Penggunaan sumber rendah
- Serasi dengan semua jangka masa
- Berfungsi dengan semua instrumen (Forex, Saham, Kripto, Niaga Hadapan)
📋 PARAMETER TERMASUK
- Bilangan Garis/Kotak (5-100)
- Peratusan Lebar Profil
- Kawalan Ketelusan
- Skema Warna Tersuai
- Pelarasan Ofset Kanan
- Mod Paparan (Delta/Isipadu)
🎯 TRANSFORMASIKAN ANALISIS CARTA ANDA HARI INI!
Sertai ribuan pedagang profesional yang telah meningkatkan analisis pasaran mereka dengan PROFIL ISIPADU LILIN DELTA BERANJAK. Berhenti meneka dan mula melihat di mana aktiviti pasaran sebenar berlaku melalui pengiraan delta berasaskan lilin yang tepat.
⭐ "Kejelasan yang dibawa oleh penunjuk ini kepada analisis isipadu tiada tandingan. Pendekatan delta berasaskan lilin adalah genius tulen."
Tambah PROFIL ISIPADU LILIN DELTA BERANJAK ke platform cTrader anda hari ini dan berdagang dengan pandangan tahap institusi!


