
APA YANG DILAKUKANNYA
Saluran Donchian dengan Konteks Jangka Masa meletakkan sempadan struktur jangka masa lebih tinggi ke atas carta semasa anda — memberikan setiap pecahan dan penarikan balik satu bingkai rujukan yang tidak disediakan oleh saluran Donchian standard.
Saluran Donchian standard melukis harga tertinggi dan terendah dalam tempoh semakan tetap pada jangka masa semasa anda. Ia berkesan untuk pengenalpastian pecahan — tetapi ia beroperasi secara berasingan. Pecahan pada carta 15 minit mungkin hanyalah bunyi dalam julat Mingguan.
Penunjuk ini menambah konteks yang hilang itu.
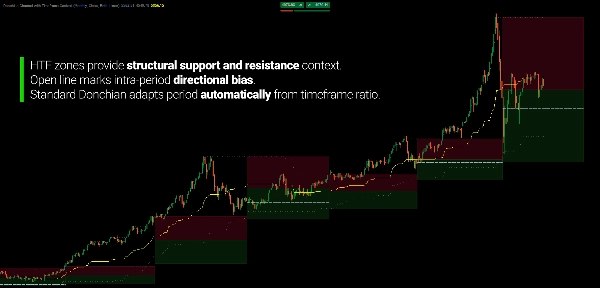
Ia mengira julat tempoh jangka masa lebih tinggi sebelumnya dan memproyeksikannya sebagai zon sokongan/rintangan pada carta pelaksanaan anda. Anda melihat kedua-duanya: Saluran Donchian standard yang menjejaki ekstrem harga jangka masa semasa, dan konteks jangka masa lebih tinggi yang menunjukkan di mana harga berada berbanding sempadan struktur yang lebih besar.
Hasilnya adalah Saluran Donchian yang tahu di mana ia berada dalam gambaran yang lebih besar.
KENAPA KONTEKS JANGKA MASA PENTING
Saluran Donchian adalah salah satu sistem pecahan yang paling dihormati dalam perdagangan. Konsep asal Richard Donchian — beli harga tertinggi, jual harga terendah — kekal sebagai asas strategi mengikuti tren. Tetapi saluran itu sendiri tidak memberitahu anda sama ada pecahan yang anda lihat adalah signifikan secara struktur.
Masalahnya
Pecahan Donchian standard pada jangka masa carta anda mencipta satu set kekecewaan biasa:
- Harga memecah di atas saluran atas pada H1 — tetapi julat Mingguan memberitahu anda ia menghadapi rintangan, bukan memulakan tren
- Harga menguji saluran bawah pada M15 — tetapi konteks Harian menunjukkan permintaan kuat di bawah yang belum diuji
- Anda memasuki perdagangan pecahan dengan keyakinan — hanya untuk melihat harga berbalik kerana pergerakan itu adalah pembetulan dalam struktur jangka masa yang lebih besar
Ini bukan kegagalan penunjuk. Ia kegagalan konteks. Saluran berfungsi seperti yang direka — ia hanya tidak tahu tentang sempadan struktur satu jangka masa di atas.
Penyelesaiannya
Penunjuk ini memproyeksikan julat Donchian tempoh jangka masa lebih tinggi sebelumnya sebagai zon visual pada carta semasa anda. Apabila harga menghampiri garis saluran standard atas atau bawah, anda segera melihat sama ada ia menuju ke atau menjauhi sempadan jangka masa lebih tinggi.
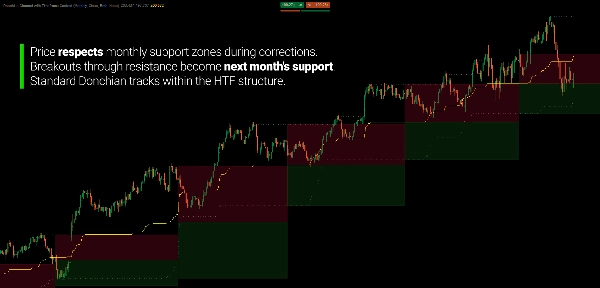
Zon jangka masa lebih tinggi membahagikan tempoh semasa kepada wilayah rintangan (di atas titik tengah) dan wilayah sokongan (di bawah titik tengah) — memberikan anda bias struktur sebelum pecahan berlaku.
KONSEP TERAS
Donchian tradisional menjawab: "Apakah harga tertinggi dan terendah dalam N bar terakhir?"
Penunjuk ini menambah: "Di mana julat itu berada berbanding julat tempoh jangka masa lebih tinggi sebelumnya?"
Sistem berfungsi dalam dua lapisan:
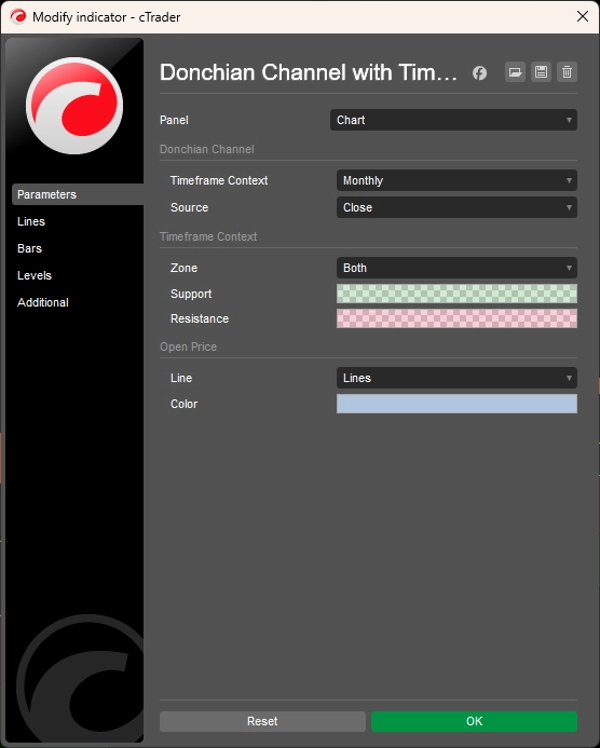
- Saluran Donchian Standard dikira pada carta semasa anda dengan tempoh yang disesuaikan secara automatik. Tempoh itu diperoleh daripada nisbah antara konteks jangka masa yang anda pilih dan jangka masa carta anda — tiada tetapan manual diperlukan. Konteks Mingguan pada carta H1 secara automatik menggunakan semakan 120 bar (5 hari × 24 jam ÷ 1 jam).
- Zon Konteks Jangka Masa mengira harga tertinggi dan terendah dari tempoh jangka masa lebih tinggi sebelumnya, kemudian memproyeksikan tahap tersebut sebagai zon berwarna merentasi tempoh semasa. Zon sokongan meluas dari sempadan bawah ke titik tengah. Zon rintangan meluas dari titik tengah ke sempadan atas.
Apabila pecahan Donchian standard berlaku dalam zon sokongan, konteks jangka masa lebih tinggi mencadangkan pergerakan itu mempunyai ruang. Apabila ia berlaku dalam zon rintangan, konteks mencadangkan berhati-hati — pecahan itu menolak terhadap bekalan struktur yang lebih besar.
APLIKASI PRAKTIKAL
Penapisan Pecahan Palsu
Kes penggunaan utama. Apabila harga memecah di atas garis saluran atas standard tetapi sudah berada jauh dalam zon rintangan HTF, pecahan itu membawa risiko pembalikan yang lebih tinggi. Zon itu menyediakan konteks untuk membezakan antara pengembangan sebenar dan ujian yang melelahkan ke dalam bekalan atas kepala.
Sebaliknya, pecahan yang berlaku berhampiran titik tengah HTF mempunyai lebih banyak ruang struktur untuk berkembang sebelum menghadapi sempadan yang lebih besar.
Keletihan Pembetulan
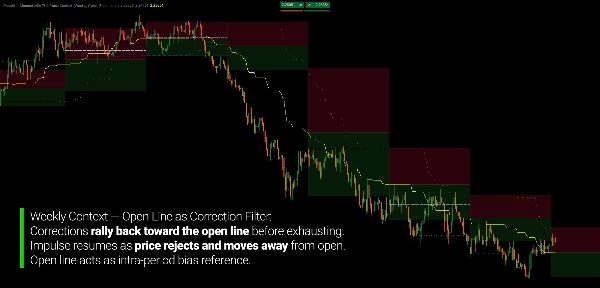
Semasa penarikan balik dalam tren, zon sokongan/rintangan HTF memberikan anda rujukan struktur untuk di mana pembetulan mungkin keletihan. Penarikan balik yang mencapai sempadan zon sokongan HTF mencadangkan penjual mungkin telah menghabiskan tenaga mereka pada tahap struktur — bersedia untuk kemungkinan pembalikan. Penarikan balik yang berhenti sebelum mencapai zon mencadangkan tren kekal kuat.
Penempatan Struktur
Sebelum sebarang isyarat pecahan berlaku, zon-zon memberitahu anda di mana harga kini berada dalam julat jangka masa lebih tinggi. Separuh atas julat HTF = berhati-hati untuk posisi panjang. Separuh bawah = berhati-hati untuk posisi pendek. Dekat titik tengah = zon neutral di mana arah kurang jelas.
Rujukan Harga Buka
Garis harga buka pilihan menandakan di mana tempoh jangka masa lebih tinggi semasa dibuka. Ini menyediakan rujukan tambahan untuk bias intra-tempoh — harga di atas buka mencadangkan kawalan bullish, di bawah mencadangkan kawalan bearish.
CIRI UTAMA
Sistem Donchian Dua Lapisan
- Saluran Donchian Standard dengan tempoh dikira automatik berdasarkan nisbah jangka masa
- Zon konteks jangka masa lebih tinggi diproyeksikan sebagai sokongan/rintangan pada carta semasa
- Kedua-dua lapisan dikemas kini secara masa nyata apabila data harga baru tiba
Pengiraan Tempoh Automatik
- Tempoh diperoleh daripada nisbah antara jangka masa konteks dan jangka masa carta
- Tiada tetapan tempoh manual — jangka masa konteks menentukan semakan secara automatik
- Menyokong carta bukan berasaskan masa (Tick, Renko, Range) dengan lalai yang boleh dikonfigurasi
Pilihan Konteks Jangka Masa
- 13 pilihan jangka masa: Bulanan hingga Minit 15
- Terapkan konteks Mingguan pada carta H1, konteks Harian pada carta M5, atau mana-mana gabungan sah
- Zon dikemas kini setiap kali tempoh jangka masa lebih tinggi baru bermula
Paparan Zon Visual
- Zon sokongan (sempadan bawah ke titik tengah) — warna boleh dikonfigurasi dengan ketelusan
- Zon rintangan (titik tengah ke sempadan atas) — warna boleh dikonfigurasi dengan ketelusan
- Mod paparan: Kedua-dua zon, Sokongan sahaja, Rintangan sahaja, atau Tiada
- Zon diproyeksikan ke hadapan hingga akhir tempoh HTF semasa
Garis Harga Buka
- Menandakan harga pembukaan tempoh jangka masa lebih tinggi semasa
- Enam pilihan gaya garis: Solid, Dots, DotsRare, DotsVeryRare, Lines, LinesDots
- Warna boleh dikonfigurasi — atau matikan sepenuhnya
Fleksibiliti Sumber Harga
- Pengiraan berasaskan tutup: menggunakan harga penutupan untuk sempadan saluran
- Pengiraan berasaskan HighLow: menggunakan sumbu tinggi/rendah untuk sempadan saluran yang lebih luas
- Satu tetapan digunakan untuk kedua-dua pengiraan standard dan konteks
MEMBACA CARTA
- Zon Hijau: Wilayah sokongan — julat bawah tempoh HTF sebelumnya diproyeksikan ke hadapan
- Zon Merah: Wilayah rintangan — julat atas tempoh HTF sebelumnya diproyeksikan ke hadapan
- Sempadan Zon (atas): Harga tertinggi tempoh HTF sebelumnya
- Sempadan Zon (bawah): Harga terendah tempoh HTF sebelumnya
- Titik Tengah Zon: Di mana zon sokongan dan rintangan bertemu — keseimbangan tempoh sebelumnya
- Garis Saluran Standard: Donchian atas/bawah/tengah jangka masa semasa
- Garis Buka: Di mana tempoh HTF semasa dibuka
Penilaian Pecahan:
- Pecahan standard KE DALAM zon sokongan HTF → sejajar tren, ruang struktur
- Pecahan standard KE DALAM zon rintangan HTF → bertentangan struktur, risiko pembalikan lebih tinggi
- Pecahan standard MELEBIHI zon HTF → wilayah baru, struktur sebelumnya tidak lagi mengandungi harga
SIAPA YANG SESUAI
Penunjuk ini direka untuk pedagang yang menggunakan saluran Donchian untuk perdagangan pecahan dan mahukan konteks struktur jangka masa lebih tinggi untuk menapis isyarat mereka.
Jika anda pernah mengalami kekecewaan memasuki pecahan Donchian yang segera berbalik — kerana mereka menolak terhadap sempadan struktur yang lebih besar yang anda tidak dapat lihat — alat ini menyediakan keterlihatan itu.
Ia sangat sesuai untuk pedagang mengikuti tren yang mahukan kriteria objektif untuk membezakan antara pecahan sebenar dan ujian yang melelahkan ke dalam bekalan atau permintaan atas kepala. Penganalisis pelbagai jangka masa akan mendapat manfaat dengan melihat konteks julat jangka masa lebih tinggi terus pada carta pelaksanaan tanpa menukar jangka masa.
Pedagang ayunan boleh menggunakan zon HTF sebagai rujukan struktur untuk kemasukan penarikan balik — mengenal pasti di mana pembetulan mungkin keletihan berdasarkan sempadan tempoh sebelumnya. Pedagang budi bicara mendapat lapisan struktur tambahan untuk konteks tanpa menambah kerumitan penunjuk.
Ini bukan sistem isyarat. Ia adalah lapisan konteks yang membantu anda menilai pecahan Donchian dalam rangka struktur pasaran jangka masa lebih tinggi.
APA YANG MEMBEZAKANNYA
Penunjuk Saluran Donchian standard beroperasi pada satu jangka masa dengan tempoh tetap. Mereka memberitahu anda bila harga melebihi ekstrem terkini — tetapi tidak tentang sama ada ekstrem itu penting secara struktur.
Penunjuk ini memperkenalkan kesedaran jangka masa lebih tinggi terus ke dalam rangka kerja Donchian. Zon konteks menjawab soalan yang saluran standard tidak boleh: Adakah pecahan ini menolak ke dalam bekalan struktur? Adakah penarikan balik ini mencapai permintaan struktur? Di mana saya dalam julat yang lebih besar?
Pengiraan tempoh automatik menghapuskan sumber kebimbangan parameter yang biasa. Daripada memilih antara semakan 20, 50, atau 100 bar, tempoh diperoleh secara semula jadi daripada hubungan jangka masa. Konteks Mingguan pada carta jam menghasilkan semakan yang betul secara automatik — tiada pengoptimuman diperlukan.
Hasilnya adalah Saluran Donchian yang beroperasi dengan kesedaran struktur dan bukan secara berasingan.
---
MEMAHAMI KONTEKS PELBAGAI JANGKA MASA DALAM PERDAGANGAN PECAHAN
Perdagangan pecahan adalah mudah dari segi konsep: harga melebihi sempadan julat, mencadangkan komitmen arah. Cabarannya bukan mengenal pasti pecahan — tetapi membezakan antara pecahan yang membawa kepada tren dan pecahan yang segera gagal.
Kebanyakan pecahan palsu berkongsi ciri biasa: ia berlaku pada tahap yang signifikan secara struktur pada jangka masa lebih tinggi. Pecahan 15 minit ke dalam rintangan Mingguan bukanlah pecahan dari perspektif Mingguan — ia adalah ujian sempadan yang diketahui.
Inilah sebabnya konteks pelbagai jangka masa adalah asas kepada penilaian pecahan. Pecahan itu sendiri berlaku pada jangka masa pelaksanaan anda. Tetapi kepentingannya ditentukan oleh di mana ia berlaku dalam struktur jangka masa lebih tinggi.
Penunjuk yang menyediakan konteks ini tidak meramalkan pecahan mana yang akan berjaya. Mereka membantu anda memahami persekitaran struktur di mana setiap pecahan berlaku — supaya anda boleh menilai risiko dengan lebih tepat dan mengelakkan mengambil posisi yang melawan struktur yang lebih besar.
Jangka masa lebih tinggi tidak menggantikan jangka masa lebih rendah. Ia memberikan konteks kepadanya.
---
Perdagangan melibatkan risiko. Penunjuk ini adalah alat analisis teknikal — sentiasa gunakan pengurusan risiko yang betul.


![Logo "[Stellar Strategies] Market Session Ultimate"](https://cdn.ctrader.com/image/webp/61ffd537-0125-4246-9e72-42eca1791d64_28232)


