Penerangan
🚀 Ubah Carta Anda menjadi Pusat Keputusan Strategik
Smart Tech Analysis bukan sekadar penunjuk.
Ia adalah papan pemuka analisis pintar lengkap, dibangunkan untuk pedagang yang mahukan kejelasan, ketepatan, dan kelincahan dalam membuat keputusan.
Manakala kebanyakan penunjuk hanya memberikan maklumat terpencil, Smart Tech Analysis menggabungkan:
✔ Trend
✔ Isipadu
✔ Fibonacci
✔ Sokongan dan Rintangan
✔ Isyarat Teknikal
✔ Cadangan Operasi
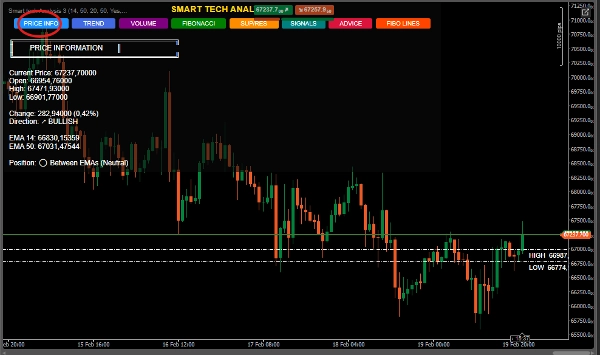
✔ Maklumat Harga Terperinci
Semua dalam satu papan pemuka dinamik dan interaktif.
🔥 PERBEZAAN BESAR
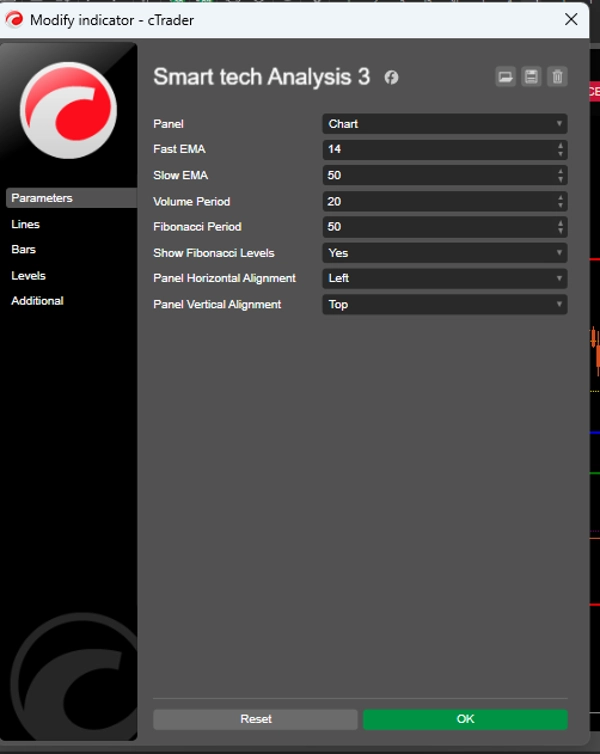
🎯 1. Sistem 6-dalam-1 – Analisis Bersepadu
Anda tidak perlu lagi bertukar antara pelbagai penunjuk.
Smart Tech Analysis menggabungkan:
📈 EMA pantas dan perlahan (14 dan 50)
📊 Isipadu dengan analisis perbandingan
🧩 Fibonacci automatik
🛡 Sokongan dan rintangan dinamik
🚦 Penjanaan isyarat pintar
📌 Cadangan dengan stop dan sasaran yang dikira
👉 Ini mengurangkan bunyi visual dan meningkatkan objektiviti.
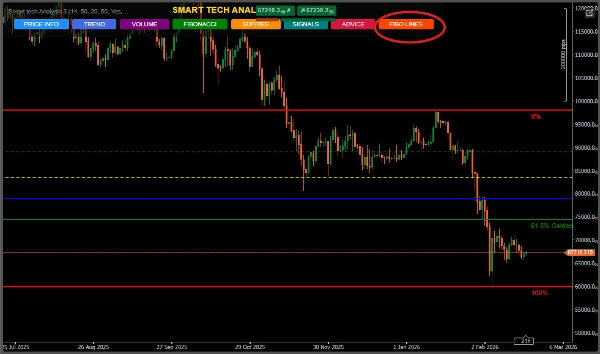
🧠 2. Panel Interaktif Eksklusif
Antara muka profesional dengan butang pintar:
MAKLUMAT HARGA
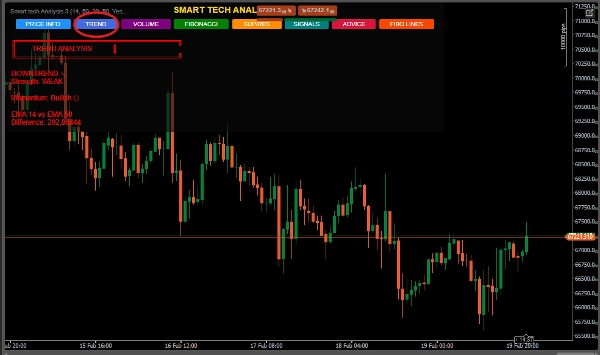
TREND
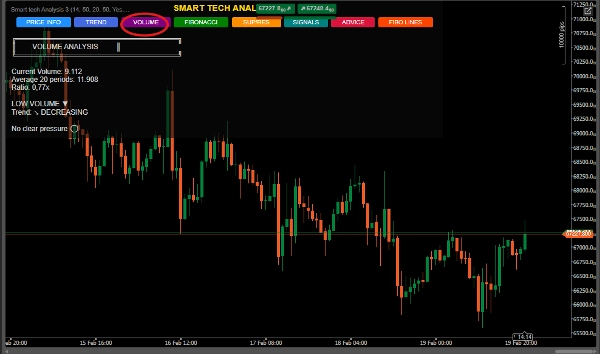
ISIPADU
FIBONACCI
SOKONGAN/RINTANGAN
ISYARAT
NASIHAT
Pedagang memilih dengan tepat apa yang mereka mahu lihat.
📌 Organisasi.
📌 Kawalan.
📌 Profesionalisme.
📈 3. Analisis Trend dengan Kekuatan dan Momentum
Ia bukan sekadar menunjukkan sama ada ia naik atau turun.
Ia mengira:
Kekuatan trend
Peratusan kekuatan antara EMA
Klasifikasi: Lemah, Sederhana, atau Kuat
Ini mengelakkan kemasukan lemah dalam pasaran mendatar.
📊 4. Isipadu dengan Bacaan Institusi
Sistem mengenal pasti:
Isipadu melampau
Tekanan membeli atau menjual
Pecutan atau perlahan
Perbandingan dengan purata sejarah
👉 Sesuai untuk mengesan kemungkinan aktiviti institusi.
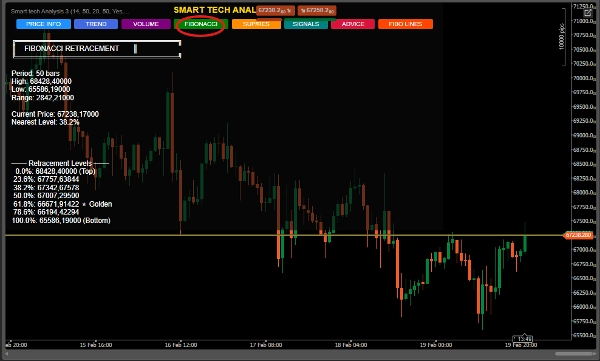
🧩 5. Fibonacci Automatik dengan Zon Emas
Dikira secara dinamik sepanjang tempoh yang ditetapkan.
Sorotan khas untuk:
⭐ Zon 61.8% (Zon Emas)
📌 Pengenalpastian tahap terdekat
📌 Sambungan menaik dan menurun
📌 Cadangan kontekstual automatik
Sesuai untuk pedagang retracement dan swing.
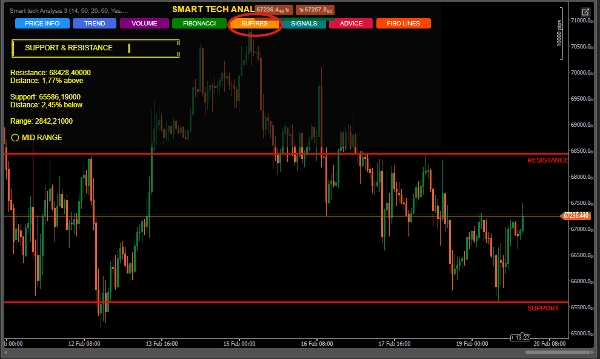
🛡 6. Sokongan & Rintangan Pintar
Mengesan paras tinggi dan rendah yang relevan
Menunjukkan jarak peratusan dari harga semasa
Mengklasifikasikan posisi: Dekat sokongan, rintangan, atau julat tengah
Melukis garis automatik pada carta
Sesuai untuk memasuki zon strategik.
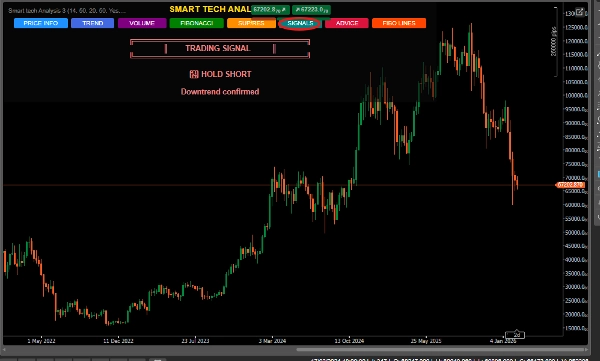
🚦 7. Sistem Isyarat Konfluens
Algoritma tidak menjana isyarat rawak.
Ia menggabungkan:
✔ Persilangan EMA
✔ Kedekatan dengan sokongan/rintangan
✔ Struktur trend
✔ Konteks harga
Klasifikasi:
🟢 BELI KUAT
🔴 JUAL KUAT
📈 TAHAN PANJANG
📉 TAHAN PENDEK
⏸ TUNGGU
Dengan tahap keyakinan yang ditunjukkan.
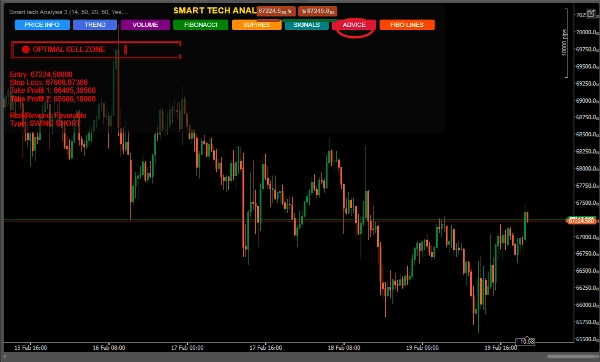
🎯 8. Cadangan dengan Pengurusan Risiko
Panel "NASIHAT" menyampaikan:
Cadangan kemasukan
Stop Loss Teknikal
Dua sasaran Take Profit
Struktur swing (Panjang atau Pendek)
Konteks operasi
👉 Ia bukan sekadar analisis.
👉 Ia adalah pelan berstruktur.
🏆 Siapa yang sesuai menggunakan penunjuk ini?
✔ Pedagang pemula yang memerlukan kejelasan
✔ Pedagang pertengahan yang mahukan konfluens
✔ Pedagang maju yang mencari kecekapan
✔ Pedagang swing
✔ Scalper yang menggunakan pengesahan struktur
💎 Mengapa ia menonjol di pasaran? Penunjuk Biasa Smart Tech Analysis
Maklumat Terpencil Analisis Bersepadu Pencemaran Visual Papan Pemuka Teratur Tiada Konteks Konfluens Teknikal Tiada Pengurusan Cadangan Stop dan Sasaran Isyarat Mudah Isyarat dengan Pengesahan
📊 Manfaat Langsung
✔ Mengurangkan keputusan emosi
✔ Meningkatkan ketepatan
✔ Memperbaiki bacaan struktur
✔ Menjimatkan masa
✔ Meningkatkan standard profesional pedagang
🧠 Penentuan Posisi Pasaran
Smart Tech Analysis sesuai untuk:
Pasaran Forex
Indeks
Komoditi
Mata wang kripto


![Logo "Gaussian Channel [Iridio Capital]"](https://cdn.ctrader.com/image/webp/7c039209-5573-4a54-a072-f9528b503103_41960)


