


Descrizione
AMS Hierarchical Market Cycle Mapper Pro
AMS Hierarchical Market Cycle Mapper Pro is a visual market-cycle indicator designed to help traders understand where price may be within a larger market rhythm.
The indicator highlights important cycle highs and lows, shows candle-count information, marks strong breakout candles, displays key Fibonacci zones, and projects possible future price and time areas where the next market reaction may develop.
It is built for traders who want a cleaner way to read market structure across multiple timeframes without manually marking every swing, candle count, or retracement zone.
What This Indicator Helps You See
The indicator is designed to visually show:
- Recent market-cycle highs and lows
[1H High] [1H Low] [4H High] [4H Low] [Daily High] [Daily Low] [Weekly High] [Weekly Low] - Candle counts from important cycle points
[27 candles] [30 candles] - Possible cycle failure areas
[1H FAIL / 4H TOP] [4H FAIL / D TOP] [D FAIL / WEEKLY] - Key Fibonacci support and resistance zones
[0.382] [0.500] [0.786] - Strong momentum candles
[Bull PC] [Bear PC] - Moving-average confluence
[10>21] [10<21] - Possible future target zones
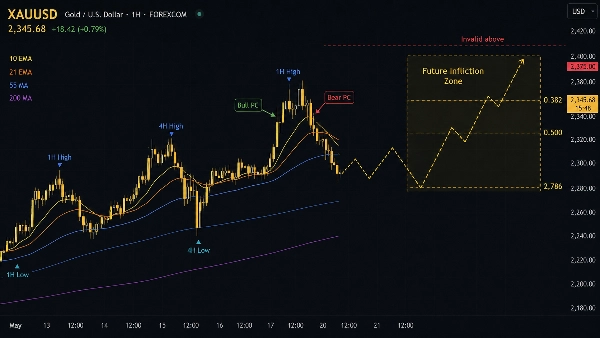
[Future Infliction Zone] - Estimated time windows for the next cycle reaction
[Next bottom window] [Next top window] - Projected corrective paths
[Wave A] [Wave B] [Wave C Target] - Invalidation levels for projected paths
[Invalid above] [Invalid below]
The goal is to make the chart easier to read and help traders focus on structure, timing, and important decision zones.
Main Chart Features
Cycle Markers [1H High] [1H Low] [4H High] [4H Low] [Daily High] [Daily Low] [Weekly High] [Weekly Low]
The indicator marks important cycle highs and lows across different timeframes.
You can choose to display:
- 1-Hour cycle markers
[1H High] [1H Low] - 4-Hour cycle markers
[4H High] [4H Low] - Daily cycle markers
[Daily High] [Daily Low] - Weekly cycle markers
[Weekly High] [Weekly Low]
Each timeframe has its own visual style so you can quickly identify which cycle is being shown.
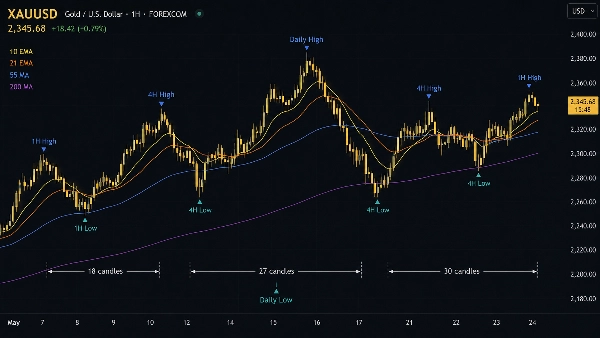
Candle Count Labels [candles]
When enabled, the indicator shows how many candles have passed within the current cycle movement.
Example labels may appear as:
[18 candles][27 candles][30 candles]
This helps traders understand whether a cycle is still developing, maturing, or reaching an area where a reaction may become more likely.
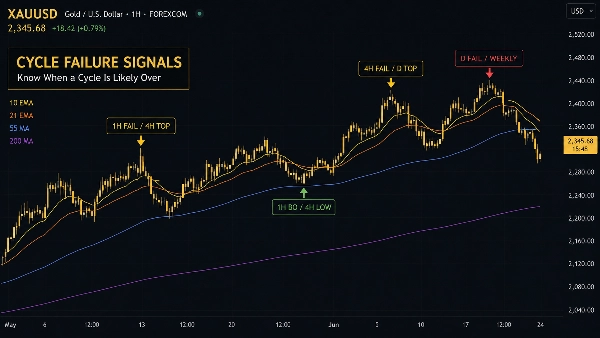
Cycle Failure Signals [1H FAIL / 4H TOP] [4H FAIL / D TOP] [D FAIL / WEEKLY]
Cycle failure signals appear when price shows signs that one cycle may be breaking down or shifting direction.
Common labels include:
[1H FAIL / 4H TOP]— suggests a 4H top may be forming after a 1H failure[1H BO / 4H LOW]— suggests a 4H low may be forming after a 1H breakout[4H FAIL / D TOP]— suggests a Daily top may be forming after a 4H failure[4H BO / D LOW]— suggests a Daily low may be forming after a 4H breakout[D FAIL / WEEKLY]— suggests the Weekly cycle may be entering correction[D BO / WEEKLY]— suggests the Weekly cycle may be turning upward[W FAIL / MONTHLY]— suggests the Monthly structure may be weakening[W BO / MONTHLY]— suggests the Monthly structure may be improving
These signals are intended to help traders spot moments where a smaller cycle may be confirming a change in a larger cycle.
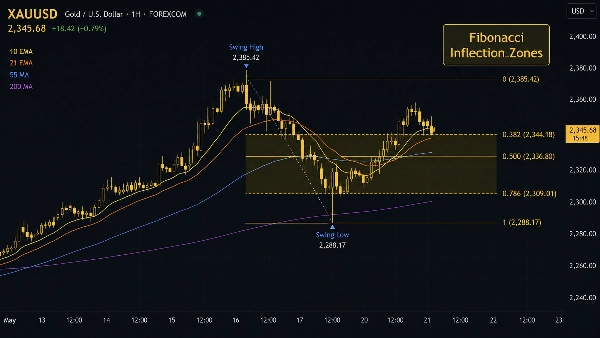
Fibonacci Inflection Zones [0.382] [0.500] [0.786]
The indicator automatically displays important Fibonacci zones on the chart.
The main levels shown are:
[0.382][0.500][0.786]
These areas are often watched as possible support, resistance, bounce, rejection, or target zones.
When shaded zones are enabled, the indicator visually highlights the area between these levels to make the important price zone easier to see.
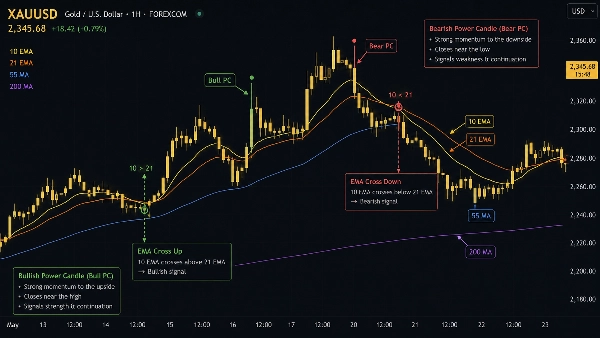
Power Candle Highlights [Bull PC] [Bear PC]
Power Candles are marked when the indicator detects a strong directional candle.
Labels shown on the chart:
[Bull PC]— strong bullish momentum candle[Bear PC]— strong bearish momentum candle
These candles can help traders identify moments where momentum may be increasing and price may be breaking through an important level.
Moving Averages [10 EMA] [21 EMA] [55 MA] [200 MA]
The indicator includes optional moving averages for additional trend context.
You can display:
- 10 EMA
[10 EMA] - 21 EMA
[21 EMA] - 55 Moving Average
[55 MA] - 200 Moving Average
[200 MA]
The indicator can also show short-term moving average cross labels:
[10>21]— short-term momentum improving[10<21]— short-term momentum weakening
These can help traders see short-term direction, trend strength, and possible support or resistance areas.
Future Projection Features
The indicator also includes optional projection tools to help visualize possible future price behavior.
These projections are not predictions. They are visual planning tools designed to show possible areas of interest based on the current market structure.
Future Target Zones [Future Infliction Zone]
When enabled, the indicator draws a forward target box on the right side of the chart.
This box highlights the area where price may react if the current cycle continues to develop.
The label may appear as:
[Future Infliction Zone][Target zone:0.382/ 0.5 / 0.786]
This helps traders quickly identify the next important price zone to watch.
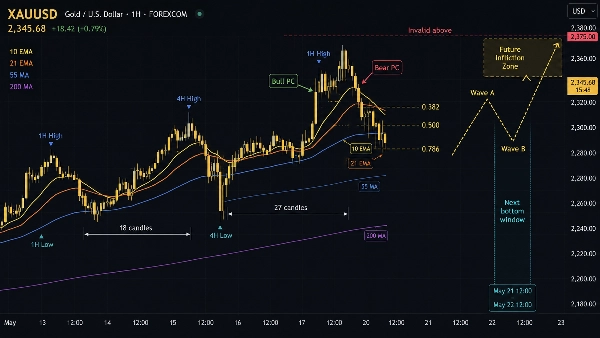
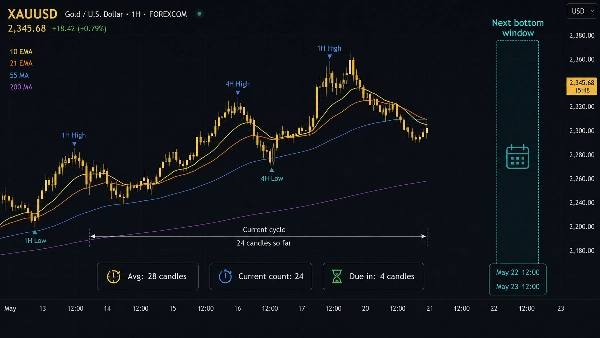
Cycle Time Windows [Next bottom window] [Next top window]
The indicator can display a future time window where the next cycle high or low may become more likely.
Common labels include:
[Next bottom window][Next top window][Avg: candles][Current count][Due in: candles]
This gives traders a visual idea of when to start paying closer attention, instead of only focusing on price levels.
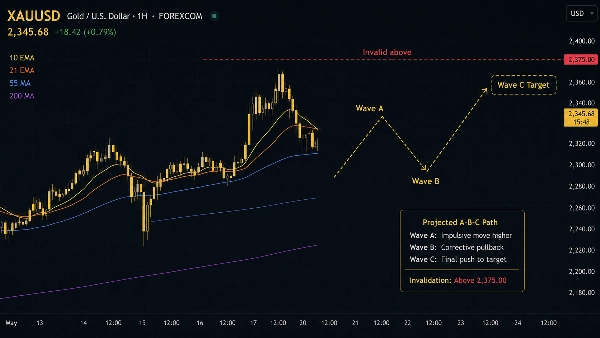
Projected A-B-C Path [Wave A] [Wave B] [Wave C Target]
The A-B-C path feature draws a simple visual path showing one possible correction or continuation structure.
Labels shown on the chart:
[Wave A][Wave B][Wave C Target]
This is useful for planning scenarios, especially when price appears to be correcting within a larger cycle.
Invalidation Lines [Invalid above] [Invalid below]
Invalidation lines show the level where the current projection may no longer be valid.
Common labels include:
[Invalid above][Invalid below][Bearish path invalid above][Bullish path invalid below]
This helps traders clearly identify the price area that would cancel the current projected scenario.
Settings Guide
Visibility Settings
Use this section to turn the main chart features on or off.
You can control:
- 1H markers
[1H High] [1H Low] - 4H markers
[4H High] [4H Low] - Daily markers
[Daily High] [Daily Low] - Weekly markers
[Weekly High] [Weekly Low] - Candle count labels
[candles] - Failure signals
[FAIL] [BO] - Fibonacci zones
[0.382] [0.500] [0.786] - Power Candle highlights
[Bull PC] [Bear PC]
Recommended settings for a cleaner chart:
- Keep 4H and Daily markers enabled
- Keep Fibonacci Zones enabled
- Keep Power Candles enabled
- Turn off lower-timeframe markers if the chart becomes too crowded
Cycle Timeframe Settings
This section controls which timeframes are used for cycle tracking.
Default settings are suitable for most traders:
- 1H for short-term cycles
[1H High] [1H Low] - 4H for medium-term cycles
[4H High] [4H Low] - Daily for higher-timeframe structure
[Daily High] [Daily Low] - Weekly for major market direction
[Weekly High] [Weekly Low]
Pivot Sensitivity Settings
This controls how sensitive the cycle markers are.
Lower values create more frequent cycle markers.
Higher values create fewer but stronger cycle markers.
Suggested use:
- Use lower sensitivity for active intraday trading
- Use higher sensitivity for cleaner swing-trading charts
Fibonacci Zone Settings [0.382] [0.500] [0.786]
This section controls which cycle source is used for Fibonacci zones.
Common choices:
- 4H for active trading
- Daily for swing trading
- Weekly for larger market structure
Enable shaded zones if you want the Fibonacci areas to be easier to see.
Power Candle Settings [Bull PC] [Bear PC]
This section controls how strict the Power Candle detection should be.
A stricter setting will show fewer signals.
A more flexible setting will show more signals.
For most users, the default settings are recommended.
Moving Average Settings [10 EMA] [21 EMA] [55 MA] [200 MA]
Use this section to choose which moving averages appear on the chart.
Suggested setup:
- 10 EMA and 21 EMA for short-term momentum
[10 EMA] [21 EMA] - 55 MA for medium-term trend structure
[55 MA] - 200 MA for major trend direction
[200 MA]
Optional cross labels:
[10>21][10<21]
You can turn off moving averages if you prefer a cleaner chart.
Projection Settings
This section controls the future projection tools.
You can turn on or off:
- Future target zones
[Future Infliction Zone] - Cycle time windows
[Next bottom window] [Next top window] - Projected A-B-C paths
[Wave A] [Wave B] [Wave C Target] - Invalidation lines
[Invalid above] [Invalid below]
Suggested beginner setup:
- Enable Future Target Zones
[Future Infliction Zone] - Enable Invalidation Lines
[Invalid above] [Invalid below] - Keep A-B-C Path optional
[Wave A] [Wave B] [Wave C Target] - Enable Time Windows only if you use cycle timing
[Next bottom window] [Next top window]
Projection Mode
The indicator includes different projection modes.
Auto Latest Confirmed
This mode automatically uses the latest confirmed cycle structure.
This is best for users who want the indicator to handle projection selection automatically.
Possible chart labels may include:
[4H top confirmed by 1H failure][4H bottom confirmed by 1H breakout][Daily top confirmed by 4H failure][Daily bottom confirmed by 4H breakout][Weekly correction implied by Daily failure][Weekly bottom implied by Daily breakout]
Current Structure Modes
You can also manually select a structure source, such as:
- 1H current structure
[1H current structure projection] - 4H current structure
[4H current structure projection] - Daily current structure
[Daily current structure projection] - Weekly current structure
[Weekly current structure projection]
This is useful when you want to focus on a specific trading timeframe.
Suggested Use
For intraday traders, a good starting setup is:
- Chart timeframe: 15-minute, 30-minute, or 1-hour
- Cycle focus: 1H and 4H
[1H High] [1H Low] [4H High] [4H Low] - Fibonacci source: 4H
[0.382] [0.500] [0.786] - Projection mode: Auto Latest Confirmed
For swing traders, a good starting setup is:
- Chart timeframe: 1-hour, 4-hour, or daily
- Cycle focus: 4H, Daily, and Weekly
[4H High] [4H Low] [Daily High] [Daily Low] [Weekly High] [Weekly Low] - Fibonacci source: Daily
[0.382] [0.500] [0.786] - Projection mode: Daily current structure or Auto Latest Confirmed
Important Note
This indicator is a visual market-structure tool. It should not be used as a standalone buy or sell signal.
Always combine it with your own trading plan, risk management, confirmation method, and market understanding.
The projections shown by the indicator are possible scenarios, not guaranteed outcomes.
Riepilogo
Discussioni
Recensioni dei clienti
Domande frequenti
Potrebbe interessarti anche





Prezzo