Penerangan
DONCHIAN MARKET & TREND INTELLIGENCE (EDISI cTRADER)
Keadaan Pasaran Institusi, Diagnostik Volatiliti & Enjin Trend Pelbagai Horizon untuk cTrader
BERHENTI MENEBAR TEKAAN. MULAKAN PERDAGANGAN DENGAN KETEPATAN KUANTITATIF.
Kebanyakan isyarat pecahan gagal kerana penunjuk standard melayan setiap lonjakan harga dengan cara yang sama.
Enjin ini mengukur pemampatan volatiliti, penjajaran trend struktur, dan susulan aliran pesanan sebenar sebelum anda mempertaruhkan satu dolar pun.
Ketahui dalam masa kurang tiga saat sama ada pergerakan itu merupakan pengembangan institusi yang tulen atau perangkap kecairan yang direka.
Berhenti menatap garisan saluran buta yang dicat semula.
Mulakan perdagangan dengan kecerdasan pasaran yang lengkap.
MENGAPA KEBANYAKAN PENUNJUK TRADISIONAL GAGAL KEPADA ANDA (DAN MENGOSONGKAN AKAUN ANDA)
Anda sudah sangat biasa dengan senario ini.
Anda duduk di hadapan skrin, menyaksikan harga menolak dengan agresif melepasi paras tertinggi yang telah ditetapkan. Penunjuk standard menunjukkan hijau. Anda masuk posisi panjang. Tiga lilin kemudian, momentum hilang sepenuhnya, harga jatuh kembali ke dalam julat, dan stop loss anda terkena pada palsu yang jelas.
Penunjuk tradisional membuat anda terbang dalam keadaan buta:
- Mereka tertinggal berpuluh-puluh bar, memberi amaran hanya selepas pergerakan sudah habis.
- Mereka dicat semula atau menggerakkan ambang mereka secara dinamik di tengah lilin, mengubah sasaran apabila anda paling memerlukan kejelasan.
- Mereka mencipta kekacauan carta, memaksa anda mengendalikan 5 hingga 10 penunjuk yang bertentangan yang mencetuskan kebuntuan analisis.
Bagaimana jika carta anda menjalankan audit kuantitatif berterusan pada setiap bar yang ditutup—mengukur kelajuan volatiliti, pembersihan sempadan sebenar, dan persetujuan trend pelbagai horizon secara automatik?
MEMPERKENALKAN TERMINAL KUANTITATIF DALAM CARTA ANDA
Temui Enjin Kecerdasan Pasaran & Trend (Edisi cTrader).
Ini adalah terminal diagnostik institusi yang bersatu dibina secara asli dalam cTrader, mengubah tindakan harga mentah menjadi kecerdasan pasaran yang boleh diambil tindakan.
Daripada melayan garisan sempadan sebagai penanda visual mudah, enjin ini menggunakan sempadan harga yang tidak digerakkan secara ketat sebagai pembantu asas—menjalankan model matematik lanjutan merentasi peratusan volatiliti sejarah, derivatif kadar perubahan, kecekapan arah, dan momentum struktur.
Fikirkan ia sebagai komputer penerbangan dan pengesan penipuan dalam carta anda. Ia tidak hanya menunjukkan di mana harga berada; ia menilai bagaimana harga sampai ke sana, sama ada volatiliti menyokong pengembangan, dan sama ada aliran pesanan asas mempunyai kuasa struktur untuk mengekalkan pergerakan itu.
KEJELASAN PASARAN SEGERA 3 SAAT: PAPARAN HEADS-UP (HUD)
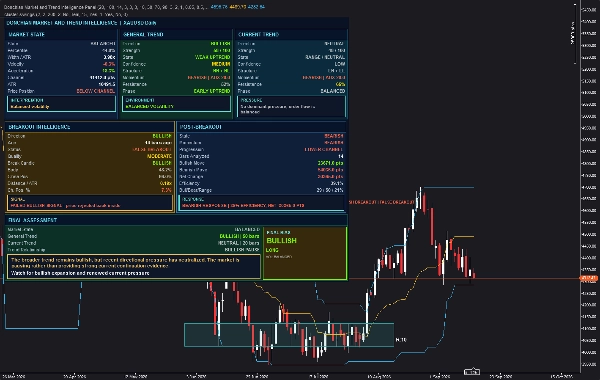
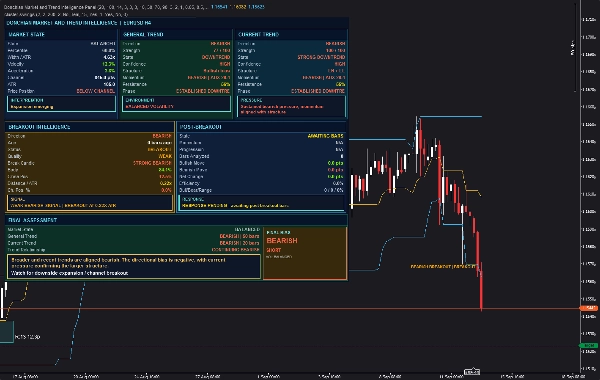
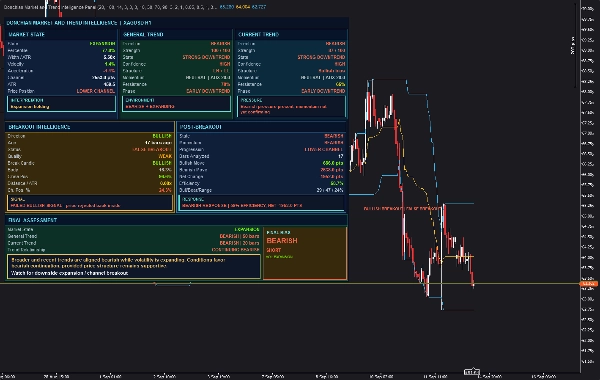
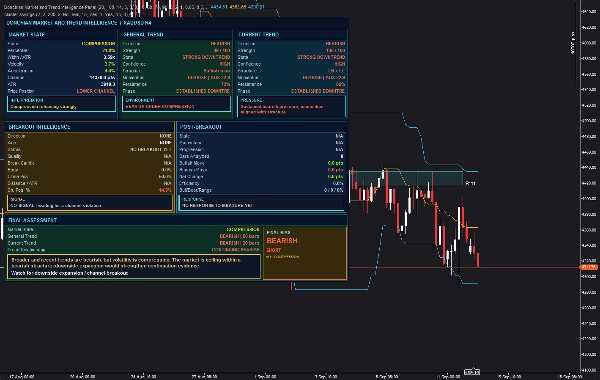
Direka secara asli untuk antara muka moden cTrader, HUD bersepadu menyediakan diagnosis pasaran segera terhadap mana-mana tema carta gelap tanpa mengacaukan ruang kerja anda.
text
+----------------------------------------------------------------------------------------------------+
| DONCHIAN MARKET AND TREND INTELLIGENCE | EURUSD H1 |
+------------------------------------+-----------------------------------+---------------------------+
| [ MARKET STATE ] | [ GENERAL TREND ] | [ CURRENT TREND ] |
| State: EXTREME COMPRESSION | Direction: BULLISH | Direction: BULLISH |
| Percentile: 8.4% | Strength: 82 / 100 | Strength: 76 / 100 |
| Width/ATR: 3.12x | Confidence: HIGH | Confidence: HIGH |
| Velocity: +4.2% | Structure: HH + HL | Structure: HH + HL |
| Price Pos: UPPER CHANNEL | Momentum: BULLISH | ADX 32.4 | Momentum: BULLISH |
| > "Compression releasing strongly" | > "BULLISH UNDER COMPRESSION" | > "Sustained pressure" |
+------------------------------------+-----------------------------------+---------------------------+
| [ BREAKOUT INTELLIGENCE ] | [ POST-BREAKOUT METRICS ] |
| Status: VALID CONTINUATION | Age: 4 bars ago | Efficiency: 68.4% |
| Break Dist: 0.84x ATR | Quality: STRONG | Net Travel: +42.5 pts |
| Candle: STRONG BULLISH | Close Pos: 88.2% | Bull/Bear/R: 75/25/0 % |
| > STRONG BULLISH SIGNAL | VALID AT 0.84X ATR | > BULLISH RESPONSE |
+------------------------------------------------------------------------+---------------------------+
| [ FINAL ASSESSMENT ] | [ FINAL BIAS ] |
| Deduction: Broader and recent trends aligned. Volatility expanding. | BULLISH |
| Watch: Watch for sustained upside expansion and structural holds. | [ LONG BIAS ] |
+------------------------------------------------------------------------+---------------------------+
- Persekitaran Volatiliti Makro (Kiri Atas): Menjawab "Apakah rejim pasaran yang kita berada?" Menilai peratusan mampatan sejarah dan derivatif kadar perubahan matematik.
- Matriks Trend Dua Horizon (Kanan Atas): Menjawab "Adakah trend luas menyokong tekanan segera?" Memisahkan ayunan struktur makro daripada momentum segera.
- Forensik Pecahan & Pelaksanaan (Baris Tengah): Menjawab "Adakah pergerakan ini nyata atau perangkap?" Menganalisis mekanik badan lilin, perpindahan melepasi ambang harga yang tidak digerakkan, dan menjejaki kecekapan selepas pecahan bar demi bar.
- Sintesis Taktikal Boleh Diambil Tindakan (Baris Bawah): Menjawab "Apakah bias perdagangan muktamad sekarang?" Mensintesis data pelbagai faktor kompleks ke dalam deduksi bahasa Inggeris mudah, keadaan tontonan tepat, dan lencana perdagangan keyakinan tinggi (PANJANG, PENDEK, atau BACAAN TERBELAH).
DI BAWAH HUD: 4 ENJIN ANALITIK GRED INSTITUSI
1. ENJIN VOLATILITI & PEMAMPATAN REJIM
- Skor Peratusan Volatiliti Sejarah: Menormalkan lebar saluran terhadap Julat Benar Purata (ATR) merentasi jangka masa yang boleh disesuaikan (lalai: 100 bar) untuk mengira peratusan volatiliti tepat 0–100%. Anda segera tahu sama ada pasaran sedang terkumpul dalam PEMAMPATAN EKSTREM atau terlalu melampau dalam PELUASAN EKSTREM.
- Dinamik Terbitan Ke-1 & Ke-2 (Kelajuan & Pecutan): Menggunakan cerun regresi linear untuk mengukur kelajuan (Kelajuan) dan pecutan pengembangan volatiliti. Anda mengesan tenaga terkumpul sebelum pecahan berlaku, menangkap pergerakan sebagai momentum kinetik letupan dilepaskan.
- Klasifikasi Rejim Stabil Histeresis: Menggunakan penimbal histeresis matematik (lalai: 3.0%) merentasi peralihan keadaan untuk mengelakkan isyarat berbalik dengan cepat dan mengganggu semasa keadaan bergelora.
2. FORENSIK & PENGESAHAN PECAHAN
- Mekanisme Sempadan Bar Sebelumnya Tidak Digeser yang Ketat: Menilai peristiwa pecahan terhadap ekstrem yang dikira ketat sebelum bar yang dinilai. Ini menghalang lilin pecahan daripada menggerakkan sasaran sendiri, mengekalkan integriti matematik mutlak.
- Ambang Pembersihan Dinormalisasi ATR: Memerlukan penutupan bar melebihi ambang saluran dengan gandaan tepat ATR (≥0.05×ATR≥0.05×ATR untuk kelayakan; ≥0.50×ATR≥0.50×ATR untuk klasifikasi kuat), serta-merta menapis bunyi sub-pip yang tidak ketara.
- Pengesanan Pecahan Palsu, Ujian Semula & Imbasan Kecairan Automatik: Menjejaki tindakan harga selepas isyarat untuk mengkategorikan pergerakan ke dalam SAH, DIUJIKAN SEMULA, DIIMBAS (penolakan sumbu ≥35%≥35%), atau PECAHAN PALSU (harga ditolak kembali ke dalam).
3. PENJEJAKAN DRIFT & KECEKAPAN PASCA-PECAHAN
- Nisbah Kecekapan Perpindahan Arah: Mengukur jarak bersih yang diperoleh berbanding jumlah pergerakan harga kasar merentasi semua bar selepas pecahan. Anda boleh segera membezakan larian institusi yang bersih (≥50%≥50% kecekapan) daripada pengedaran yang bergelora dan berkemungkinan rendah.
- Pecahan Komposisi Bar demi Bar: Mengaudit setiap bar berikutnya sebagai Bullish, Bearish, atau Ranging, menunjukkan sama ada pembeli atau penjual mengekalkan kawalan berterusan lilin demi lilin.
4. PENILAIAN TREND DUA HORIZON & KALIBRASI STRUKTUR
- Penilaian Trend Multi-Lookback Terpisah: Mengaudit struktur pasaran luas (Trend Umum, lalai: 50 bar) bersama aliran pesanan segera (Trend Semasa, lalai: 20 bar) untuk memastikan anda berada di sisi aliran makro yang betul.
- Matriks Penilaian Trend Multi-Faktor: Menggabungkan geometri ayunan struktur (Tinggi Lebih Tinggi/Rendah Lebih Tinggi vs Tinggi Lebih Rendah/Rendah Lebih Rendah), cerun EMA dinormalisasi ATR, ketekunan arah, dan penjajaran vektor ADX/DMS ke dalam skor objektif 0–100.
DIBINA DENGAN KETEPATAN INSTITUSI: TIADA CAT SEMULA, TIADA KOMPROMI
- Pelaksanaan 100% Tanpa Cat Semula: Algoritma analitik teras dijalankan pada bar yang ditutup (
index - 1). Apa yang anda lihat pada carta sejarah sepadan dengan pelaksanaan langsung tik demi tik. - Seni Bina C# Asli Sub-Milisaat: Dibina dengan kemas untuk API cTrader (.NET). Tiada DLL luaran, tiada permintaan web awan, dan tiada kelewatan carta.
- Penjejakan Harga Langsung Sensitif Tik: Keadaan analitik kekal terkunci pada bar yang ditutup untuk menghapuskan amaran palsu, sementara koordinat posisi harga dikemas kini secara dinamik pada setiap tik langsung.
- Keserasian Instrumen Universal: Secara automatik menyesuaikan merentasi Forex, Crypto, Indeks, Logam, dan Tenaga melalui saiz tik asli dan normalisasi ATR.
- Memori Kitaran Hayat Acara Berterusan: Menjejaki, mengesahkan, dan menamatkan kitaran pecahan dengan bijak, mengimbas semula hanya sejarah harga segar apabila acara tidak sah.
- Amaran Asli Segera: Terima pemberitahuan pop-up masa nyata dan isyarat audio arah apabila persediaan sah berlaku.
4 BUKU MAIN PERDAGANGAN BERKEMUNGKINAN TINGGI YANG BOLEH ANDA GUNAKAN HARI INI
- Buku Main 1: Pengembangan Pemampatan Volatiliti
Persediaan: Harga telah berkonsolidasi selama berjam-jam. Papan pemuka memaparkan PEMAMPATAN EKSTREM (Peratusan < 10%) dengan Kelajuan dan Pecutan menjadi positif.
Tindakan: Anda bersedia untuk pengembangan letupan. Apabila bar ditutup di luar sempadan sebelumnya dengan lilin BULLISH KUAT dan pembersihan >0.50×ATR>0.50×ATR, anda masuk posisi panjang awal—menunggang lonjakan sementara yang lain masih menunggu pengesahan. - Buku Main 2: Menapis Imbasan Kecairan Institusi
Persediaan: Harga menembusi rintangan, tetapi lilin pecahan mencetak sumbu atas panjang (≥35%≥35% daripada julat keseluruhan). Pada bar seterusnya, enjin menandakan status sebagai DIIMBAS dan harga ditutup kembali di dalam saluran.
Tindakan: Daripada terperangkap membeli di puncak, anda mengelakkan perdagangan panjang sepenuhnya—atau melaksanakan pendek kontra-trend pantas kembali ke median. - Buku Main 3: Ujian Semula Trend Multi-Horizon
Persediaan: Trend Umum menunjukkan UPTREND KUAT (Skor > 80/100, Keyakinan Tinggi), manakala Trend Semasa menunjukkan PENARIKAN BEARISH sementara. Harga menarik kembali ke sempadan atas, bertahan tanpa ditutup di dalam, dan papan pemuka memaparkan DIUJIKAN SEMULA.
Tindakan: Anda melaksanakan kemasukan sambungan keyakinan tinggi yang selaras dengan trend makro dominan dengan tahap pembatalan yang ketat dan jelas. - Buku Main 4: Audit Kesihatan & Momentum Pecahan
Persediaan: Anda berada dalam posisi pendek selepas penurunan. Lima bar kemudian, panel Pasca-Pecahan menunjukkan Kecekapan: 78%, Pergerakan Bearish: 85%, dan Perkembangan: SALURAN RENDAH.
Tindakan: Enjin mengesahkan susulan yang kuat dan tiada geseran bertentangan. Anda membiarkan pemenang anda berjalan dengan keyakinan penuh dan bukannya menutup terlalu awal.
DARI PEMBUKAAN CARTA KE PERDAGANGAN KEYAKINAN TINGGI DALAM 5 LANGKAH MUDAH
- Periksa Keadaan Pasaran: Lihat panel kiri atas. Adakah kita dalam Pemampatan (terkumpul), Pengembangan (trend aktif), atau Keadaan Seimbang?
- Sahkan Penjajaran Multi-Horizon: Periksa panel Trend Umum dan Semasa. Adakah kedua-dua horizon memaparkan warna yang sama dan menunjukkan Keyakinan Tinggi?
- Periksa Kualiti Pecahan: Apabila harga menguji sempadan, periksa panel Kecerdasan Pecahan. Sahkan struktur lilin, jarak pembersihan ATR, dan pastikan status adalah SAH (bukan DIIMBAS atau PALSU).
- Audit Kecekapan Susulan: Semak panel Pasca-Pecahan. Cari skor Kecekapan ≥50%≥50% untuk mengesahkan komitmen institusi.
- Baca Bias Akhir: Periksa kad Penilaian Akhir untuk arah perdagangan anda (PANJANG / PENDEK), baca deduksi taktikal, dan laksanakan dengan pengurusan risiko yang berdisiplin.
DISESUAIKAN SEPENUHNYA DARI KOTAK — BOLEH DISESUAIKAN UNTUK SEBARANG GAYA
Parameter lalai dikalibrasi secara kuantitatif untuk analisis pasaran gred institusi pada jangka masa H1/H4 standard. Laraskan mana-mana tetapan untuk padan dengan kelas aset atau gaya perdagangan khusus anda:
- Tetapan Garis Asas Sempadan: Laraskan rujukan lookback asas (Lalai:
20). - Parameter Volatiliti & Rejim: Konfigurasikan lookback peratusan sejarah (
100), pelicinan (3), tempoh ATR (14), lookback derivatif (3), dan ambang mampatan/pengembangan (10%,30%,70%,90%dengan3.0%histeresis). - Forensik Pecahan & Lilin: Tetapkan gandaan kelayakan ATR (Minimum:
0.05x, Kuat:0.50x), peraturan pengesahan (1 bar), horizon persaraan (3 bar di dalam), dan penapis kekuatan badan lilin (60% badan,75% posisi tutup). - Penilaian Trend & Kalibrasi Struktur: Sesuaikan lookback makro (
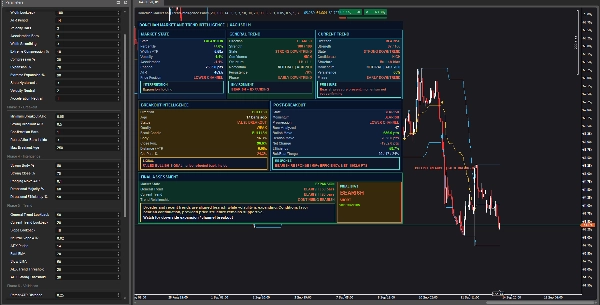
50), lookback mikro (20), ambang ADX (20.0/30.0), pelicinan EMA berganda (20/50), dan kepekaan sumbu imbasan (35%). - Penyesuaian HUD Visual & Amaran: Laraskan penempatan sudut papan pemuka (KiriAtas, KananAtas, KiriBawah, KananBawah), lebar panel, skala fon, pembalutan teks wawasan, label carta, dan amaran audio/pop-up.
APA YANG ANDA TERIMA HARI INI: SET PERDAGANGAN LENGKAP & PANDUAN STRATEGI PERCUMA
- Akses Penuh kepada Penunjuk Kecerdasan Pasaran & Trend untuk cTrader (.NET)
- BONUS PERCUMA: Panduan Strategi & Penggunaan Lengkap (PDF)
Disertakan secara percuma dengan setiap pembelian. Panduan komprehensif ini membimbing anda melalui pelan persediaan lengkap, buku main kitaran volatiliti, model pembalikan pecahan palsu, dan penyelarasan parameter langkah demi langkah untuk kelas aset yang berbeza. - Kemas Kini & Penambahbaikan Sepanjang Hayat: Semua penambahbaikan dan pengoptimuman masa depan disertakan tanpa kos tambahan.
- Sokongan Pembangun Khusus: Bantuan langsung untuk persediaan, konfigurasi, dan pertanyaan ciri.
TINGKATKAN RUANG KERJA cTRADER ANDA HARI INI
Pasaran tidak menunggu anda bersedia.
Setiap sesi perdagangan, modal dipindahkan dari pedagang runcit yang meneka pada carta yang penuh kekacauan kepada pedagang berdisiplin yang menggunakan kecerdasan pasaran objektif dan pelbagai faktor.
Anda boleh terus bergelut dengan penunjuk yang dicat semula, isyarat bertentangan, dan pecahan palsu yang mengecewakan. Atau anda boleh melengkapkan platform cTrader anda dengan enjin kecerdasan gred institusi yang mentafsir volatiliti, mengesahkan pecahan, dan mengkuantifikasi struktur trend pada setiap bar.
Klik "Beli" untuk mendapatkan akses segera, muat turun Panduan Strategi Percuma anda, dan tingkatkan carta cTrader anda ke standard institusi hari ini.
Penunjuk cTrader | Enjin Kecerdasan Pasaran | Pengesan Pemampatan Volatiliti | Alat Pengesahan Pecahan | Papan Pemuka Trend Tanpa Cat Semula | Analisis Trend Pelbagai Jangka Masa | Penapis Volatiliti ATR | Pengesan Imbasan Kecairan | Forensik Tindakan Harga | Terminal Perdagangan Institusi
Ringkasan
Key features include a dual-horizon trend matrix that decouples broad market structure from immediate momentum, breakout forensics that validate moves against strict prior-bar boundaries and ATR-normalized thresholds, and a post-breakout drift tracker measuring directional efficiency and bar-by-bar control. The dashboard synthesizes these data points into a clear final trade bias with actionable insights.
The tool supports universal instrument compatibility across Forex, Crypto, Indices, Metals, and Energies, and offers customizable parameters for boundary lookbacks, volatility thresholds, breakout criteria, and trend scoring. It provides a native, non-repainting C# implementation optimized for cTrader, featuring a clean heads-up display (HUD) with real-time updates and native alerts.
Included are four high-probability trading playbooks addressing volatility squeeze expansions, liquidity sweeps, multi-horizon trend retests, and breakout momentum audits, plus a comprehensive strategy guidebook. This indicator transforms raw price action into quantitative market intelligence to assist traders in making informed decisions.