คำอธิบาย
เครื่องตรวจจับจุดสูงต่ำของสวิง
การตรวจจับสวิงด้วยการวิเคราะห์ความเบี่ยงเบน
--------------------------------------------------
ระบุสวิง ตรวจจับความเบี่ยงเบน เทรดด้วยความสอดคล้อง
--------------------------------------------------
สิ่งที่ตัวบ่งชี้นี้ทำ
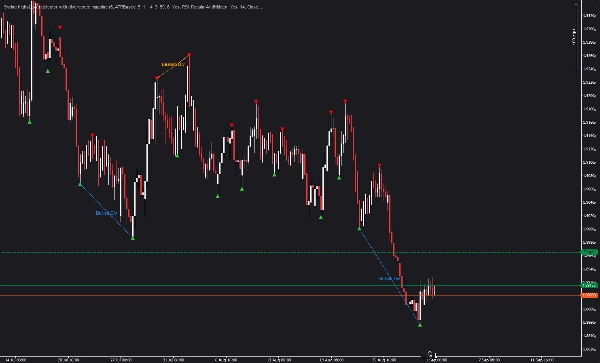
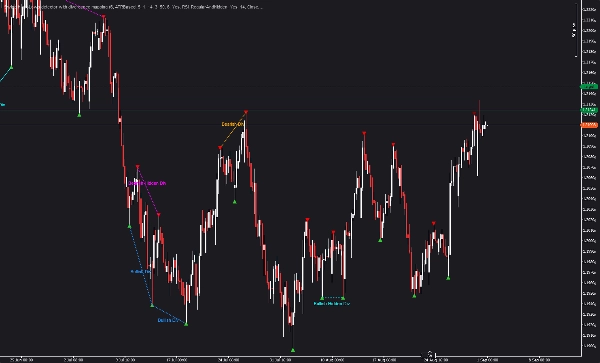
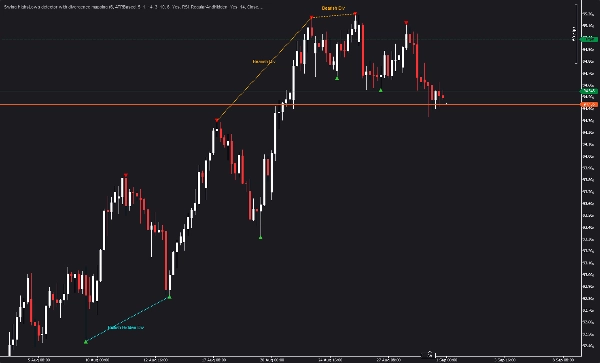
ตัวบ่งชี้นี้จะตรวจจับจุดสูงต่ำของสวิงเชิงโครงสร้างโดยอัตโนมัติด้วยการตั้งค่าความลึกและการกรองความเบี่ยงเบนที่ปรับได้ จากนั้นจะวิเคราะห์ RSI และ MACD เพื่อตรวจจับความเบี่ยงเบนแบบปกติและแบบซ่อนเร้นระหว่างสวิงที่ต่อเนื่องกันของประเภทเดียวกัน
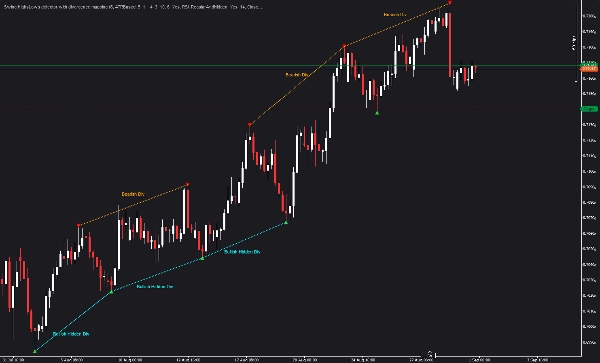
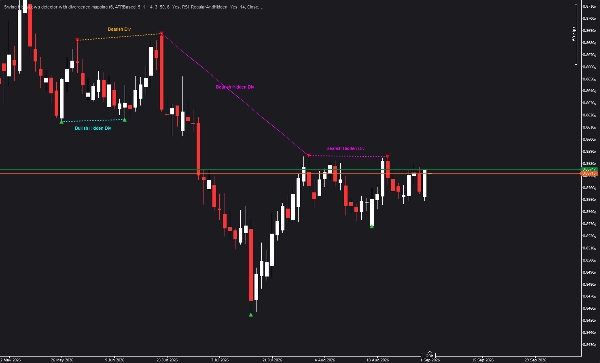
ความเบี่ยงเบนเป็นสัญญาณกลับตัวที่ทรงพลัง ความเบี่ยงเบนแบบปกติแสดงถึงการกลับตัวของแนวโน้มที่เป็นไปได้ ในขณะที่ความเบี่ยงเบนแบบซ่อนเร้นแสดงถึงการต่อเนื่องของแนวโน้มที่เป็นไปได้ ตัวบ่งชี้นี้จะระบุทั้งสองแบบและแสดงผลโดยตรงบนแผนภูมิของคุณ
--------------------------------------------------
ตรรกะหลักและการคำนวณ
ตัวบ่งชี้จะตรวจจับจุดสวิงโดยใช้วิธีการหาค่าสูงสุดต่ำสุดในท้องถิ่นด้วยความลึกที่ปรับได้ แต่ละจุดสวิงจะได้รับการตรวจสอบกับเกณฑ์ความเบี่ยงเบนเพื่อให้แน่ใจว่าจะแสดงเฉพาะสวิงที่มีนัยสำคัญเท่านั้น ความเบี่ยงเบนสามารถตั้งค่าเป็นค่าคงที่ในหน่วยพิปส์หรือปรับตามความผันผวนโดยใช้ ATR
เมื่อระบุสวิงแล้ว ตัวบ่งชี้จะคำนวณค่า RSI และ MACD ที่แต่ละจุดสวิง จากนั้นจะเปรียบเทียบสวิงที่ต่อเนื่องกันของประเภทเดียวกัน (สูงถึงสูง ต่ำถึงต่ำ) เพื่อตรวจจับความเบี่ยงเบนแบบปกติและแบบซ่อนเร้น ความเบี่ยงเบนแบบปกติเกิดขึ้นเมื่อราคาทำจุดสูงสุดที่สูงขึ้นแต่ RSI/MACD ทำจุดสูงสุดที่ต่ำกว่า (แนวโน้มขาลง) หรือราคาทำจุดต่ำสุดที่ต่ำกว่าแต่ RSI/MACD ทำจุดต่ำสุดที่สูงกว่า (แนวโน้มขาขึ้น) ความเบี่ยงเบนแบบซ่อนเร้นเกิดขึ้นเมื่อราคาทำจุดสูงสุดที่ต่ำกว่าแต่ RSI/MACD ทำจุดสูงสุดที่สูงกว่า (แนวโน้มขาลง) หรือราคาทำจุดต่ำสุดที่สูงกว่าแต่ RSI/MACD ทำจุดต่ำสุดที่ต่ำกว่า (แนวโน้มขาขึ้น)
แหล่งที่มาของความเบี่ยงเบนสามารถเลือกได้ระหว่าง RSI, MACD หรือทั้งสองแบบ ประเภทความเบี่ยงเบนสามารถเลือกได้เฉพาะแบบปกติ แบบซ่อนเร้น หรือทั้งสองแบบ สวิงที่ยังไม่ยืนยันสามารถรวมอยู่ในการตรวจจับความเบี่ยงเบนเพื่อให้สัญญาณเร็วขึ้น
สถานะเครื่องจักรสวิงปัจจุบันติดตามสวิงที่ยังไม่ยืนยัน (U) ซึ่งยังอยู่ในระหว่างการก่อตัว สวิงเหล่านี้จะแสดงเป็นสีเหลืองและสามารถเปลี่ยนเป็นยืนยันหรือถูกยกเลิกได้ตามการเคลื่อนไหวของราคา
--------------------------------------------------
คุณสมบัติหลัก
- การตรวจจับสวิงอัตโนมัติ: ระบุจุดสูงต่ำของสวิงโดยใช้ความลึกและการกรองความเบี่ยงเบนที่ปรับได้
- การตรวจจับความเบี่ยงเบนแบบปกติ: ระบุสัญญาณความเบี่ยงเบนคลาสสิกที่บ่งชี้การกลับตัวของแนวโน้มที่เป็นไปได้
- การตรวจจับความเบี่ยงเบนแบบซ่อนเร้น: ระบุสัญญาณความเบี่ยงเบนแบบซ่อนเร้นที่บ่งชี้การต่อเนื่องของแนวโน้มที่เป็นไปได้
- ความเบี่ยงเบนของ RSI และ MACD: เลือก RSI, MACD หรือทั้งสองเป็นแหล่งที่มาของความเบี่ยงเบน
- การตั้งค่าความเบี่ยงเบนที่ปรับได้: ความเบี่ยงเบนแบบพิปส์คงที่หรือแบบใช้ ATR ปรับตามความผันผวนของตลาด
- การติดตามสวิงที่ยังไม่ยืนยัน: แสดงสวิงที่เป็นไปได้ (U) ขณะที่ยังอยู่ในระหว่างการก่อตัว
- การควบคุมการย้อนกลับ: จำกัดจำนวนจุดสวิงที่แสดงเพื่อเพิ่มประสิทธิภาพ
- สีที่ปรับแต่งได้: สีแยกสำหรับจุดสูงที่ยืนยันแล้ว จุดต่ำที่ยืนยันแล้ว สวิงที่ยังไม่ยืนยัน และประเภทความเบี่ยงเบน
- ไม่มีการวาดซ้ำ: การคำนวณทั้งหมดอิงจากข้อมูลในอดีต
--------------------------------------------------
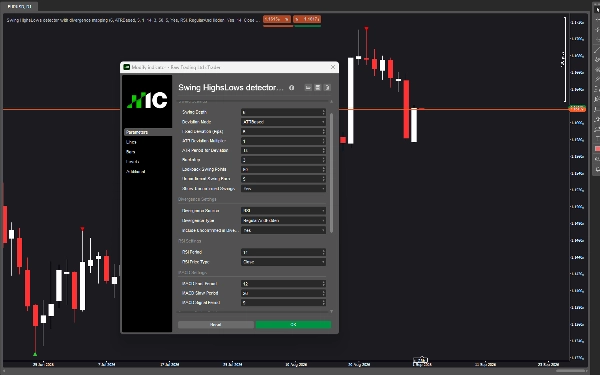
คู่มือพารามิเตอร์
การตั้งค่าสวิง
ความลึกของสวิง: พารามิเตอร์นี้ควบคุมจำนวนแท่งเทียนที่ตรวจสอบทั้งสองข้างของแท่งเทียนเพื่อกำหนดว่าคือจุดสูงหรือต่ำของสวิง ค่าที่สูงกว่าจะให้จำนวนสวิงน้อยลงแต่มีความสำคัญมากขึ้น ค่าที่ต่ำกว่าจะให้จำนวนสวิงมากขึ้น ค่าเริ่มต้นคือ 10 สำหรับกรอบเวลาที่ต่ำกว่าเช่น M5 และ M15 ควรพิจารณาใช้ 6 ถึง 8 สำหรับกรอบเวลาที่สูงกว่าเช่น H4 ขึ้นไป ควรพิจารณาใช้ 12 ถึง 16
โหมดความเบี่ยงเบน: พารามิเตอร์นี้เลือกได้ระหว่างพิปส์คงที่และความเบี่ยงเบนแบบใช้ ATR พิปส์คงที่จะใช้ระยะห่างราคาขั้นต่ำคงที่ระหว่างสวิง ความเบี่ยงเบนแบบใช้ ATR จะปรับตามความผันผวนโดยใช้ตัวคูณของค่า ATR ปัจจุบัน ค่าเริ่มต้นคือพิปส์คงที่
ความเบี่ยงเบนคงที่ (พิปส์): เมื่อใช้โหมดพิปส์คงที่ พารามิเตอร์นี้ตั้งค่าระยะห่างขั้นต่ำระหว่างสวิงที่ต่อเนื่อง ค่าเริ่มต้นคือ 5.0 เพิ่มค่านี้เพื่อกรองสวิงที่เล็กลงและเน้นการเคลื่อนไหวโครงสร้างที่ใหญ่ขึ้น ลดค่านี้เพื่อจับสวิงได้มากขึ้น
ตัวคูณความเบี่ยงเบน ATR: เมื่อใช้โหมดแบบใช้ ATR พารามิเตอร์นี้คูณค่าปัจจุบันของ ATR เพื่อกำหนดความเบี่ยงเบนขั้นต่ำ ค่าเริ่มต้นคือ 0.5 ค่าสูงกว่าจะให้สวิงน้อยลง ค่าต่ำกว่าจะให้สวิงมากขึ้น
ช่วงเวลา ATR สำหรับความเบี่ยงเบน: เมื่อใช้โหมดแบบใช้ ATR พารามิเตอร์นี้ตั้งค่าช่วงเวลาสำหรับการคำนวณ ATR ค่าเริ่มต้นคือ 14 ช่วงเวลาที่สั้นกว่าจะให้ค่า ATR ที่ตอบสนองมากขึ้น ช่วงเวลาที่ยาวกว่าจะให้ค่าที่เรียบขึ้น
Backstep: พารามิเตอร์นี้ตั้งค่าจำนวนแท่งเทียนขั้นต่ำระหว่างสวิง ค่าเริ่มต้นคือ 3 เพิ่มค่านี้เพื่อป้องกันไม่ให้สวิงปรากฏใกล้กันเกินไป ลดค่านี้เพื่อให้สวิงเกิดขึ้นบ่อยขึ้น
จำนวนจุดสวิงย้อนหลัง: พารามิเตอร์นี้จำกัดจำนวนจุดสวิงที่แสดงเพื่อเพิ่มประสิทธิภาพ ค่าเริ่มต้นคือ 50 เพิ่มค่านี้เพื่อดูบริบทประวัติศาสตร์มากขึ้น ลดค่านี้เพื่อประสิทธิภาพที่เร็วขึ้นบนเครื่องที่ช้ากว่า
จำนวนแท่งเทียนสวิงที่ยังไม่ยืนยัน: พารามิเตอร์นี้ตั้งค่าจำนวนแท่งเทียนหลังจากสวิงที่เป็นไปได้ที่ตัวบ่งชี้จะมองหาตัวเลือกที่ดีกว่า ค่าเริ่มต้นคือ 3 ค่าสูงกว่าจะให้เวลามากขึ้นสำหรับการก่อตัวของสวิงที่ดีกว่า ค่าต่ำกว่าจะให้สัญญาณเร็วขึ้น
แสดงสวิงที่ยังไม่ยืนยัน: เมื่อเปิดใช้งาน สวิงที่เป็นไปได้ (U) จะแสดงเป็นสีเหลืองก่อนที่จะได้รับการยืนยัน ค่าเริ่มต้นคือ true ปิดใช้งานเพื่อให้แผนภูมิสะอาดขึ้นโดยแสดงเฉพาะสวิงที่ได้รับการยืนยัน
การตั้งค่าความเบี่ยงเบน
แหล่งที่มาของความเบี่ยงเบน: พารามิเตอร์นี้เลือกตัวบ่งชี้ที่ใช้สำหรับการตรวจจับความเบี่ยงเบน ตัวเลือกได้แก่ RSI, MACD หรือ RSIAndMACD RSIAndMACD ต้องการให้ทั้งสองตัวบ่งชี้แสดงความเบี่ยงเบนเพื่อให้เกิดสัญญาณ ค่าเริ่มต้นคือ RSI
ประเภทความเบี่ยงเบน: พารามิเตอร์นี้เลือกประเภทความเบี่ยงเบนที่จะตรวจจับ ตัวเลือกได้แก่ RegularOnly, HiddenOnly หรือ RegularAndHidden ค่าเริ่มต้นคือ RegularAndHidden
รวมสวิงที่ยังไม่ยืนยันในการตรวจจับความเบี่ยงเบน: เมื่อเปิดใช้งาน สวิงที่ยังไม่ยืนยันสามารถใช้เป็นสวิงปัจจุบันในการตรวจจับความเบี่ยงเบน ค่าเริ่มต้นคือ true ปิดใช้งานเพื่อให้ต้องการให้ทั้งสองสวิงได้รับการยืนยันเต็มที่ก่อนที่จะแสดงความเบี่ยงเบน
การตั้งค่า RSI
ช่วงเวลา RSI: พารามิเตอร์นี้ตั้งค่าช่วงเวลาสำหรับการคำนวณ RSI ค่าเริ่มต้นคือ 14 ค่ามาตรฐานอยู่ระหว่าง 9 ถึง 25 ช่วงเวลาที่สั้นกว่าจะให้ค่า RSI ที่ไวต่อการเปลี่ยนแปลงมากขึ้น ช่วงเวลาที่ยาวกว่าจะให้ค่าที่เรียบขึ้น
ประเภทราคาของ RSI: พารามิเตอร์นี้เลือกชุดราคาที่ใช้สำหรับการคำนวณ RSI ตัวเลือกได้แก่ Close, Open, High, Low, Typical, Median และ Weighted ค่าเริ่มต้นคือ Close
การตั้งค่า MACD
ช่วงเวลา MACD แบบเร็ว: พารามิเตอร์นี้ตั้งค่าช่วงเวลา EMA แบบเร็วสำหรับการคำนวณ MACD ค่าเริ่มต้นคือ 12
ช่วงเวลา MACD แบบช้า: พารามิเตอร์นี้ตั้งค่าช่วงเวลา EMA แบบช้าสำหรับการคำนวณ MACD ค่าเริ่มต้นคือ 26
ช่วงเวลาสัญญาณ MACD: พารามิเตอร์นี้ตั้งค่าช่วงเวลาของเส้นสัญญาณสำหรับการคำนวณ MACD ค่าเริ่มต้นคือ 9
ภาพแสดงผล
สีสวิงสูง: สีสำหรับจุดสูงของสวิงที่ได้รับการยืนยัน ค่าเริ่มต้นคือสีแดง
สีสวิงต่ำ: สีสำหรับจุดต่ำของสวิงที่ได้รับการยืนยัน ค่าเริ่มต้นคือสีเขียวมะนาว
สีสวิงสูงที่ยังไม่ยืนยัน: สีสำหรับจุดสูงของสวิงที่ยังไม่ยืนยัน (U) ค่าเริ่มต้นคือสีเหลือง
สีสวิงต่ำที่ยังไม่ยืนยัน: สีสำหรับจุดต่ำของสวิงที่ยังไม่ยืนยัน (U) ค่าเริ่มต้นคือสีเหลือง
สีความเบี่ยงเบนแบบปกติขาขึ้น: สีสำหรับเส้นความเบี่ยงเบนแบบปกติขาขึ้น ค่าเริ่มต้นคือ DodgerBlue
สีความเบี่ยงเบนแบบปกติขาลง: สีสำหรับเส้นความเบี่ยงเบนแบบปกติขาลง ค่าเริ่มต้นคือสีส้ม
สีความเบี่ยงเบนแบบซ่อนเร้นขาขึ้น: สีสำหรับเส้นความเบี่ยงเบนแบบซ่อนเร้นขาขึ้น ค่าเริ่มต้นคือสีฟ้า
สีความเบี่ยงเบนแบบซ่อนเร้นขาลง: สีสำหรับเส้นความเบี่ยงเบนแบบซ่อนเร้นขาลง ค่าเริ่มต้นคือสีม่วงแดง
แสดงป้ายกำกับ: เมื่อเปิดใช้งาน ป้ายกำกับความเบี่ยงเบนจะแสดงบนแผนภูมิ ค่าเริ่มต้นคือ true
ขนาดตัวอักษรป้ายกำกับ: พารามิเตอร์นี้ตั้งค่าขนาดตัวอักษรสำหรับป้ายกำกับความเบี่ยงเบน ค่าเริ่มต้นคือ 8
การเลื่อนป้ายกำกับความเบี่ยงเบน (พิปส์): พารามิเตอร์นี้ควบคุมระยะห่างของป้ายกำกับความเบี่ยงเบนจากเส้นความเบี่ยงเบน ค่าเริ่มต้นคือ 10
--------------------------------------------------
กรณีการใช้งาน
- ระบุจุดสูงต่ำของสวิงเชิงโครงสร้างสำหรับการวิเคราะห์โครงสร้างตลาด
- ตรวจจับความเบี่ยงเบนแบบปกติสำหรับสัญญาณกลับตัวที่เป็นไปได้
- ตรวจจับความเบี่ยงเบนแบบซ่อนเร้นสำหรับสัญญาณต่อเนื่องของแนวโน้มที่เป็นไปได้
- รวมสัญญาณความเบี่ยงเบนกับการเคลื่อนไหวของราคาเพื่อการเทรดที่มีความน่าจะเป็นสูงขึ้น
- ใช้การยืนยันความเบี่ยงเบนของ RSI และ MACD สำหรับการตัดสินใจเข้าและออก
- ติดตามสวิงที่ยังไม่ยืนยันเพื่อการตรวจจับสัญญาณล่วงหน้า
--------------------------------------------------
ขั้นตอนการทำงานที่แนะนำ
ขั้นตอนที่ 1: แนบตัวบ่งชี้ไปยังแผนภูมิของคุณด้วยการตั้งค่าเริ่มต้น
ขั้นตอนที่ 2: ระบุจุดสูงต่ำของสวิงที่ได้รับการยืนยัน (สามเหลี่ยมสีแดงและสีเขียว)
ขั้นตอนที่ 3: มองหาเส้นความเบี่ยงเบน (สีน้ำเงิน ส้ม ฟ้า ม่วงแดง) ที่เชื่อมต่อสวิงที่ต่อเนื่องกัน
ขั้นตอนที่ 4: แปลความหมายความเบี่ยงเบนแบบปกติเป็นการกลับตัวที่เป็นไปได้ และความเบี่ยงเบนแบบซ่อนเร้นเป็นการต่อเนื่องที่เป็นไปได้
ขั้นตอนที่ 5: ยืนยันสัญญาณความเบี่ยงเบนด้วยการเคลื่อนไหวของราคาหรือตัวบ่งชี้อื่นก่อนเข้าทำการเทรด
--------------------------------------------------
หมายเหตุทางเทคนิค
- ตัวบ่งชี้แบบซ้อนทับที่วาดโดยตรงบนแผนภูมิราคา
- ใช้งานได้กับทุกกรอบเวลาและสัญลักษณ์
- การตั้งค่าการตรวจจับสวิงและความเบี่ยงเบนที่ปรับได้
- ไม่มีการวาดซ้ำ; การคำนวณทั้งหมดอิงจากข้อมูลในอดีต
- ปรับแต่งเพื่อประสิทธิภาพด้วยการควบคุมการย้อนกลับ
- รองรับการใช้งานกับ cTrader
--------------------------------------------------
การสนับสนุน
รวมการอัปเดตตลอดชีพ
สำหรับข้อมูลเพิ่มเติม - คลิกโปรไฟล์นักพัฒนาด้านล่าง