
Penerangan
Penunjuk cAlgo yang diberikan, AutoPositionSizingRR, direka untuk membantu pedagang mengira dan mengurus saiz posisi secara automatik berdasarkan risiko, hentian kerugian, dan tahap ambil untung. Ia boleh disesuaikan dan boleh digunakan untuk kedua-dua pasaran saham dan forex, menyediakan maklumat terperinci tentang susunan dagangan. Berikut adalah pecahan fungsi utama dan ciri-cirinya:
Ciri-ciri Utama:
- Penentuan Saiz Posisi Berdasarkan Risiko: Mengira saiz lot optimum berdasarkan jumlah risiko yang ditetapkan dan jarak antara harga kemasukan dan hentian kerugian.
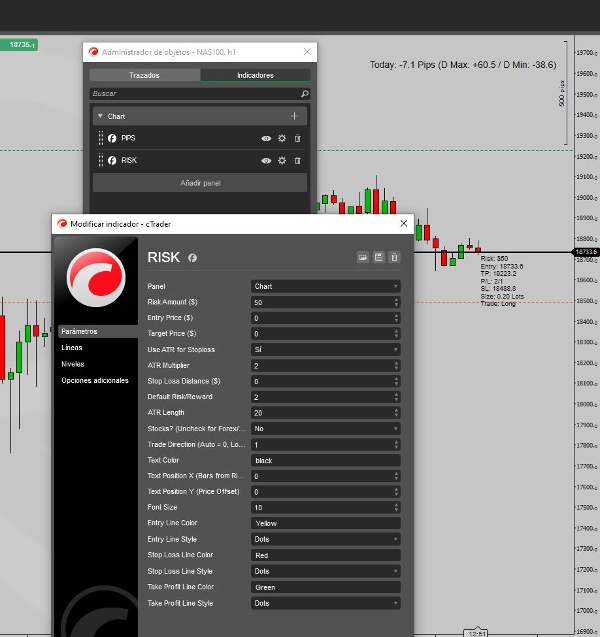
- Parameter Boleh Disesuaikan: Pengguna boleh menetapkan parameter seperti jumlah risiko, harga kemasukan, harga sasaran, jarak hentian kerugian, pengganda ATR, dan lain-lain, membolehkan pengurusan risiko yang disesuaikan.
- Hentian Kerugian dan Ambil Untung Dinamik: Ia boleh mengira hentian kerugian dan ambil untung berdasarkan sama ada jarak tetap, ATR (Purata Julat Benar), atau nisbah risiko/ganjaran yang telah ditetapkan.
- Sokongan Forex & Saham: Menyokong kedua-dua pasaran forex dan saham, menyesuaikan pengiraan berdasarkan instrumen yang didagangkan.
- Susunan Visual: Ia melukis garis mendatar pada carta untuk kemasukan, hentian kerugian, dan ambil untung, membolehkan representasi visual yang mudah bagi susunan dagangan. Ia juga memaparkan maklumat utama seperti harga kemasukan, hentian kerugian, ambil untung, saiz lot, dan jenis dagangan terus pada carta.
Cara Ia Berfungsi:
- Input: Pengguna menetapkan jumlah risiko (dalam USD), harga kemasukan, harga sasaran, dan jarak hentian kerugian (sama ada tetap atau berdasarkan ATR). ATR (Purata Julat Benar) boleh digunakan untuk mengira jarak hentian kerugian dalam pasaran yang tidak stabil.
- Pengiraan: Skrip secara automatik mengira saiz posisi dengan membahagikan jumlah risiko dengan jarak hentian kerugian (dalam pips atau nilai dolar, bergantung pada sama ada ia dagangan forex atau saham).
- Maklumat Dagangan: Memaparkan maklumat masa nyata pada carta, seperti harga kemasukan, hentian kerugian, ambil untung, dan saiz lot yang diperlukan untuk mengekalkan tahap risiko yang ditetapkan.
Ciri Visual:
- Garis Carta: Melukis tahap kemasukan, hentian kerugian, dan ambil untung sebagai garis mendatar pada carta.
- Teks Lebihan: Memaparkan butiran dagangan yang diformatkan (risiko, kemasukan, TP, SL, saiz lot, dll.) pada carta dengan kedudukan teks, warna, dan saiz fon yang boleh disesuaikan.
Penggunaan:
- Penunjuk ini berguna untuk pedagang harian, pedagang ayunan, dan scalper yang ingin mengautomasikan proses mengira saiz posisi berdasarkan ambang risiko yang ditetapkan. Ia memudahkan pengurusan dagangan dengan menyediakan petunjuk visual dan maklumat dagangan terus pada carta, yang boleh membawa kepada pembuatan keputusan yang lebih cekap.
Contoh:
- Seorang pedagang boleh menetapkan jumlah risiko sebanyak $50, harga kemasukan $100, dan menggunakan ATR untuk pengiraan hentian kerugian. Skrip akan mengira saiz posisi optimum, melukis tahap kemasukan, hentian kerugian, dan ambil untung pada carta, serta memaparkan butiran dagangan penting seperti jumlah risiko, hentian kerugian, dan potensi keuntungan.
Alat ini sesuai untuk pedagang yang mengutamakan pengurusan risiko dan mahukan cara yang terintegrasi secara visual untuk mengurus dagangan mereka.
Ringkasan
Profil indikator
Ulasan pelanggan
5.0
Ulasan: 1
5 | 100 % | |
4 | 0 % | |
3 | 0 % | |
2 | 0 % | |
1 | 0 % |
Ulasan pelanggan
April 29, 2025
it helps the review without running the trade, but it should stay as one part of the stack.
Perbincangan
Soalan Lazim
Forex
ATR
Produk yang tersedia melalui cTrader Store, termasuk bot dagangan, indikator dan plugin, disediakan oleh pembangun pihak ketiga dan diberikan akses untuk tujuan maklumat dan teknikal sahaja. cTrader Store bukan broker dan tidak memberikan nasihat pelaburan, syor peribadi atau sebarang jaminan prestasi masa hadapan.
Lebih banyak produk daripada penulis ini


Harga
Sejak 13/01/2025
2
Jualan