
Opis
Wskaźnik Time To Break Even v2
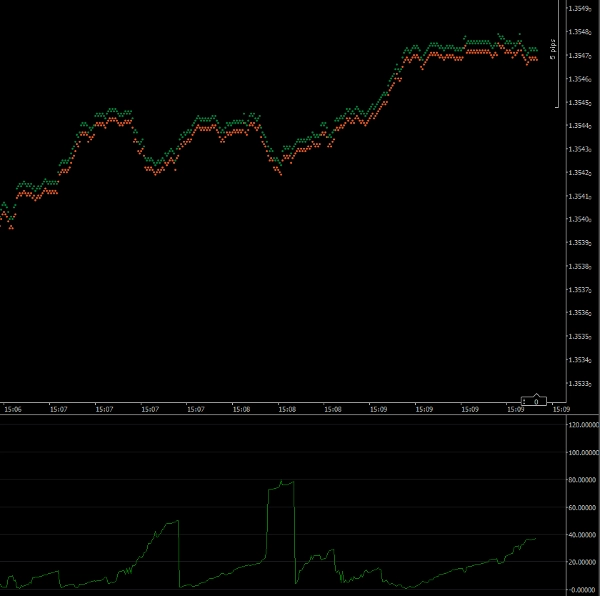
Ten wskaźnik pomoże Ci wyznaczyć moment wejścia w transakcję na rynku. Wykres pokazuje prawdopodobną liczbę sekund, po których Twoja transakcja osiągnie punkt równowagi. Jeśli rynek porusza się szybko i w Twoim kierunku, wskaźnik pokaże małą liczbę. Jeśli rynek porusza się przeciwko Tobie lub powoli, liczba będzie większa.
Wskaźnik oblicza liczbę pipsów, które Twoja transakcja potrzebuje, aby osiągnąć punkt równowagi. Następnie porównuje to z aktualną prędkością ruchu ceny.
Uwaga: Ten wskaźnik powinien być uruchamiany na interwale 1 Tick.
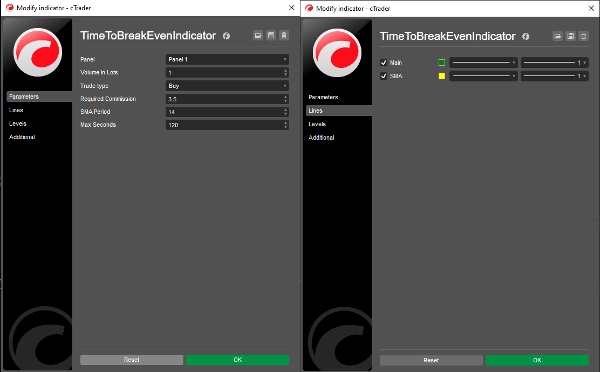
Parametry
Wolumen w lotach: Wolumen proponowanej transakcji
Typ transakcji: Czy Twoja transakcja to kupno czy sprzedaż
Wymagana prowizja: Prowizja, którą poniesie Twoja transakcja (możesz ją znaleźć w oknie Szybkiej Transakcji)
Okres SMA: Okres wykresu prostej średniej kroczącej (domyślnie = 14)
Maksymalna liczba sekund: Maksymalna liczba sekund, która będzie rejestrowana (patrz poniżej)
Linie
Główna: Linia wykresu wskaźnika (domyślnie = zielona)
SMA: Linia wykresu prostej średniej kroczącej (domyślnie = żółta)
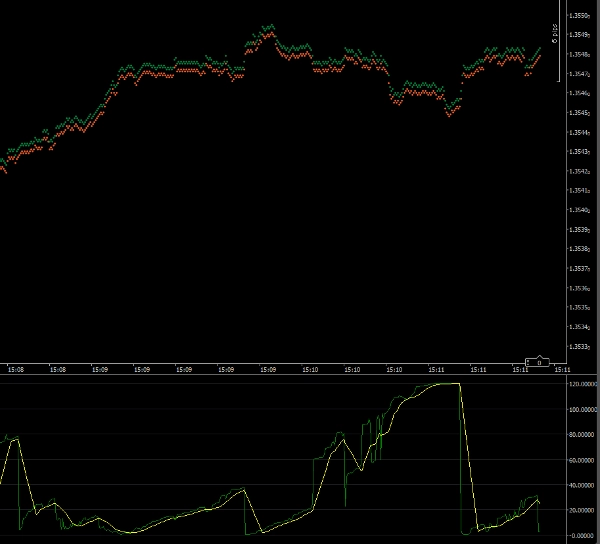
Maksymalna liczba sekund
Pozwalając wskaźnikowi wyświetlać bardzo duże wartości, skala wskaźnika uniemożliwi Ci zobaczenie szczegółów, gdy czas do punktu równowagi jest krótki. Ustawienie tego parametru pozwala określić maksymalną skalę wskaźnika. Domyślnie jest ustawiona na 120 (2 minuty). Każdy wynik równy lub większy niż 2 minuty będzie wyświetlany jako 120 sekund.
Dr Andy Larkin
Copyright 2025, Wszelkie prawa zastrzeżone
26 maja 2025
Informacje prawne
Wyniki tego wskaźnika powinny być sprawdzone pod kątem dokładności przed użyciem w handlu na żywo.
Nie udziela się żadnej gwarancji ani nie zakłada się odpowiedzialności za wyniki tego wskaźnika.
Nie ponosi się odpowiedzialności za jakiekolwiek straty wynikające z używania tego wskaźnika.
Podsumowanie
Opinie klientów
5 | 50 % | |
4 | 50 % | |
3 | 0 % | |
2 | 0 % | |
1 | 0 % |


