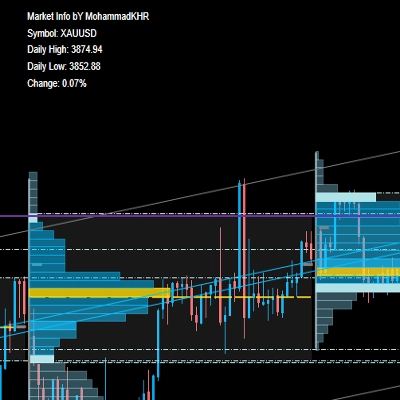
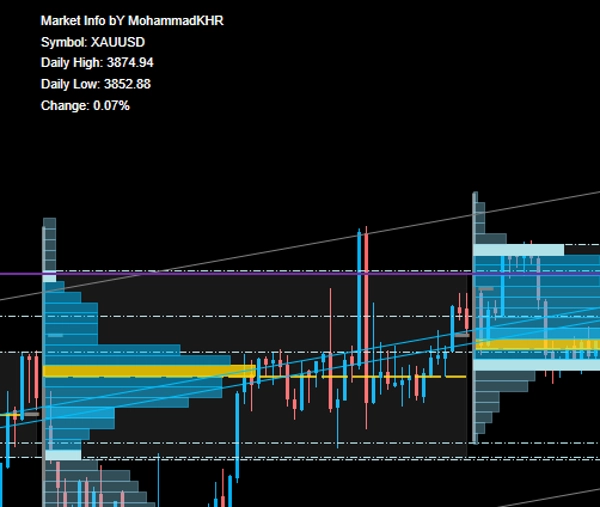
Market Info bY MohammadKHR
Indicatore
217 download
Versione 1.0, Sep 2025
Windows, Mac
Descrizione
- Massimo e minimo giornaliero: Visualizza istantaneamente i prezzi più alti e più bassi della giornata per qualsiasi strumento.
- Variazione percentuale in tempo reale: Monitora la variazione del prezzo in percentuale in tempo reale, aiutandoti a valutare rapidamente il momentum del mercato.
- Display intuitivo: Interfaccia pulita e minimalista, perfetta sia per principianti che per trader esperti.
- Gratuito da usare
Riepilogo
Riepilogo AI
Market Info by MohammadKHR is a trading indicator that provides real-time daily high and low prices for any financial instrument. It features a live percentage change display, allowing users to monitor price movements and market momentum instantly. The indicator supports various markets and symbols including Forex (e.g., EURUSD, GBPUSD, USDJPY, NZDUSD), cryptocurrencies (e.g., BTCUSD), commodities (e.g., XAUUSD), indices (e.g., NAS100), and stocks. Its user interface is designed to be clean and minimalistic, suitable for both beginners and experienced traders. This tool helps traders quickly assess daily price extremes and percentage changes to inform trading decisions.
Profilo indicatore
Recensioni dei clienti
0.0
Recensioni: 0
Recensioni dei clienti
Questo prodotto non ha ancora ricevuto recensioni. L'hai già provato? Fallo sapere agli altri per primo!
Discussioni
Domande frequenti
BTCUSD
Forex
Signal
Indices
EURUSD
Commodities
GBPUSD
NZDUSD
Prop
Crypto
Stocks
XAUUSD
NAS100
USDJPY
I prodotti disponibili tramite cTrader Store, inclusi bot di trading, indicatori e plugin, sono forniti da sviluppatori terzi e resi disponibili esclusivamente a scopo informativo e di accesso tecnico. cTrader Store non è un broker e non fornisce consulenze in materia di investimento, raccomandazioni individualizzate o garanzie di risultati futuri.


Prezzo
2
Vendite
217
Installazioni gratuite