
Daily TPO profile
Wskaźnik
213 pobrania
Wersja 1.0, Nov 2025
Windows, Mac
Opis
Codzienny profil TPO
Wskaźnik codziennego profilu TPO, który oblicza POC, VAH i VAL dla każdej sesji.
Rysuje Punkt Kontroli oraz 70% Obszaru Wartości bezpośrednio na wykresie, pomagając zidentyfikować strefy uczciwej wartości, kluczowe poziomy wsparcia/oporu oraz potencjalne obszary odrzucenia lub akceptacji ceny.
Jak to działa
Ten wskaźnik buduje codzienny profil TPO (Time Price Opportunity), podobny do profilu rynku.
Dla każdej świecy dnia handlowego:
- dzieli oś cenową na stałe „kroki” zdefiniowane przez „Rozmiar wiersza (pipsy)”
- dla każdego kroku cenowego zlicza, ile świec dotknęło tego poziomu (TPO = ile razy cena tam była notowana)
- na koniec dnia oblicza:
-
- POC (Punkt Kontroli) → poziom cenowy z największą liczbą TPO (gdzie rynek spędził najwięcej czasu)
- VAH (Wysoki Obszar Wartości) oraz VAL (Niski Obszar Wartości) → poziomy cenowe zawierające około Procent Obszaru Wartości (domyślnie 70%) wszystkich TPO dla danej sesji
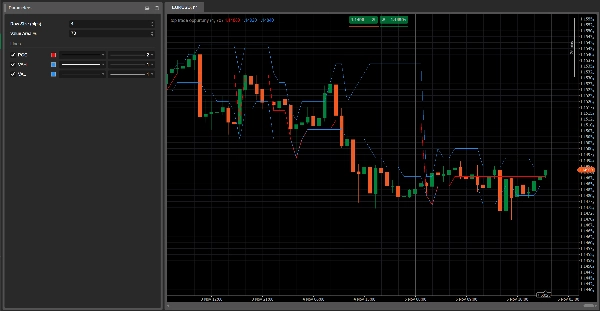
Wskaźnik rysuje na wykresie trzy linie poziome:
- Czerwona linia → POC
- Niebieskie linie → VAH (górna) i VAL (dolna)
Te linie są aktualizowane świeca po świecy podczas sesji i resetowane, gdy zaczyna się nowy dzień handlowy.
Główne parametry
Rozmiar wiersza (pipsy)
Określa grubość każdego kroku cenowego w profilu.-
- Mniejsze wartości = bardziej szczegółowy profil
- Większe wartości = gładszy profil
Procent Obszaru Wartości
Procent całkowitych TPO zawartych w Obszarze Wartości (zazwyczaj 70%).
Obszar Wartości to strefa cenowa, w której miała miejsce największa aktywność rynku w ciągu dnia.
Jak to czytać
- POC (czerwona linia)
-
- Poziom cenowy najbardziej „akceptowany” przez rynek w danym dniu.
- Często działa jako poziom równowagi: cena może się odbić, zatrzymać lub mocno przebić wokół tej strefy.
- Obszar Wartości (VAH–VAL, niebieskie linie)
-
- Reprezentuje strefę „uczciwej wartości”, gdzie odbywało się najwięcej transakcji.
- Akcja cenowa względem VAH/VAL może wskazywać na:
-
- Odrzucenie ekstremalnych cen (fałszywe wybicia poza VAH/VAL)
- Akceptację nowych cen (konsolidacja poza Obszarem Wartości)
Typowe pomysły na zastosowanie
- Cena odrzuca VAL i wraca do Obszaru Wartości → potencjalny pomysł na długą pozycję, zakładający powrót do „uczciwej wartości” (rewersja do średniej).
- Cena przebija VAH z siłą i zaczyna budować strukturę powyżej → potencjalny początek nowego wyższego obszaru wartości (scenariusz podążania za trendem).
- Kilka dni z POC na podobnym poziomie → silna strefa równowagi/akumulacji, często kluczowe wsparcie/opór.
Podsumowanie
Podsumowanie AI
The Daily TPO Profile indicator constructs a daily Time Price Opportunity (TPO) profile similar to a Market Profile, analyzing market activity by price levels throughout each trading session. It divides the price axis into fixed increments ("Row Size" in pips) and counts how many bars traded at each price step, representing TPOs. At the end of the session, it calculates three key levels: the Point of Control (POC), where the market spent the most time; the Value Area High (VAH); and the Value Area Low (VAL), which together define the price range containing approximately 70% of the trading activity.
The indicator plots these levels as horizontal lines on the chart—POC in red, VAH and VAL in blue—updating them bar by bar during the session and resetting daily. Traders use the POC as an equilibrium price level that may act as support or resistance. The Value Area highlights fair value zones, with price action near VAH and VAL signaling potential rejection or acceptance of price extremes. Typical applications include identifying mean reversion opportunities when price rejects VAL or trend-following setups when price breaks above VAH.
Main adjustable parameters include Row Size (pips), controlling profile detail, and Value Area %, defining the percentage of TPOs included in the value area. The indicator supports analysis across various markets including forex, indices, commodities, stocks, and cryptocurrencies.
Profil wskaźnika
Opinie klientów
0.0
Opinie: 0
Opinie klientów
Ten produkt nie ma jeszcze opinii. Wypróbowałeś(-aś) go już? Bądź pierwszy(-a) i powiedz o tym innym!
Dyskusja
Częste pytania
Signal
Indices
Commodities
GBPUSD
RSI
Bollinger
Fibonacci
Scalping
AI
XAUUSD
NAS100
MACD
BTCUSD
Forex
Breakout
EURUSD
NZDUSD
Martingale
Prop
ZigZag
Supertrend
Fair Value Gap
SMC
Crypto
Grid
Stocks
ATR
USDJPY
VWAP
Produkty dostępne za pośrednictwem cTrader Store, w tym boty handlowe, wskaźniki i wtyczki, dostarczane są przez deweloperów zewnętrznych i udostępniane wyłącznie w celach informacyjnych oraz w celu zapewnienia dostępu technicznego. cTrader Store nie jest brokerem i nie zapewnia doradztwa inwestycyjnego, nie udziela spersonalizowanych rekomendacji ani nie gwarantuje przyszłych wyników.


![Logo „[Stellar Strategies] MARSI Signal Plotter”](https://cdn.ctrader.com/image/webp/7b2b8da6-8f8e-4646-8d4a-4710c516c01e_25567)


Cena
42.11M
Wolumen transakcji
6.13M
Zysk w pipsach
224
Sprzedaż
8.41K
Bezpłatne instalacje