Opis
Profiler cofnięć trendu
Profiler cofnięć trendu to wskaźnik cTrader stworzony do analizy, jak trend oddycha poprzez mierzenie głębokości i częstotliwości cofnięć – teraz także w procentach zniesienia Fibonacciego.
Korzystając z filtra trendu opartego na EMA, wskaźnik:
- wykrywa, kiedy występuje wyraźny trend wzrostowy lub trend spadkowy;
- identyfikuje każde potwierdzone cofnięcie w ramach tego trendu;
- mierzy głębokość cofnięcia w pipsach;
- oblicza procent zniesienia w stylu Fibonacciego względem ostatniej nogi impulsu;
- na bieżąco śledzi:
-
- ile cofnięć wystąpiło w bieżącym trendzie,
- ostatnią głębokość cofnięcia,
- średnią głębokość cofnięcia,
- ostatni procent zniesienia Fibonacciego.
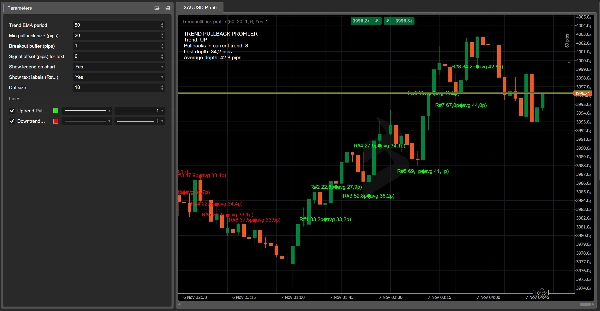
Na wykresie:
- rysuje dużą zieloną kropkę na minimum cofnięcia w trendu wzrostowym,
- dużą czerwoną kropkę na maksimum cofnięcia w trendu spadkowym,
- opcjonalnie wyświetla kompaktową etykietę, np.:
22.5 p / 38.2%.
W lewym górnym rogu dynamiczna legenda pokazuje:
- aktualny kierunek trendu (WZROST / SPADKOWY / BRAK);
- liczbę cofnięć w bieżącym trendzie;
- ostatnią głębokość cofnięcia (w pipsach);
- średnią głębokość cofnięcia (w pipsach);
- ostatni procent zniesienia Fibonacciego.
Kluczowe parametry
- Okres EMA trendu
Okres EMA używany do określenia kierunku trendu. - Minimalny rozmiar cofnięcia (pipsy)
Minimalna wymagana głębokość cofnięcia (w pipsach), aby zostało uznane za ważne zniesienie. - Bufor wybicia (pipsy)
Dodatkowa odległość, o jaką cena musi się przesunąć poza poprzedni ekstremum trendu, aby potwierdzić nową nogę i zamknąć cofnięcie. - Przesunięcie sygnału (pipsy) dla tekstu
Pionowe przesunięcie etykiet tekstowych względem maksimum/minimum cofnięcia. - Pokaż legendę na wykresie
Przełącza widoczność legendy na wykresie z trendem oraz ostatnimi i średnimi wartościami. - Pokaż etykiety tekstowe obok kropek
Jeśli włączone, wyświetla małą etykietę obok kropki z głębokością cofnięcia (opcjonalnie z procentem Fibonacciego). - Pokaż procent Fibonacciego w etykietach
Jeśli włączone, pokazuje zarówno pipsy, jak i procent Fibonacciego w etykiecie (XX.Xp / YY.Y%). - Rozmiar kropki
Kontroluje wielkość kropek na wykresie, ułatwiając zauważenie cofnięć nawet na niższych interwałach.
Praktyczne zastosowania
- Wizualne profilowanie, jak głębokie są zwykle cofnięcia na danym symbolu/interwale.
- Planowanie limitowanych wejść wokół typowych stref zniesień zamiast losowych poziomów.
- Wykrywanie nietypowo głębokich cofnięć (np. powyżej 61,8% lub 78,6%), które mogą sygnalizować wyczerpanie trendu lub możliwą zmianę kierunku.
- Dodanie obiektywnych, liczbowych informacji o cofnięciach i zniesieniach Fibonacciego do swojego podręcznika handlu trendowego.
Jak obliczane jest zniesienie Fibonacciego w Profilerze cofnięć trendu
Profiler cofnięć trendu oblicza procent zniesienia w stylu Fibonacciego na podstawie ostatniej nogi impulsu trendu, a nie na podstawie dowolnych maksimów i minimów.
W trendzie wzrostowym
- Wskaźnik śledzi nogę impulsu od:
-
- Ceny bazowej trendu = ostatnie istotne minimum (koniec poprzedniego cofnięcia)
- Ekstremum trendu = ostatnie maksimum wahań trendu
- Gdy tworzy się cofnięcie, wskaźnik mierzy:
-
- Głębokość cofnięcia (cena):
depthPrice = trendHigh – pullbackLow - Wielkość nogi impulsu:
legSize = trendHigh – trendBasePrice
- Głębokość cofnięcia (cena):
- Procent zniesienia Fibonacciego to:
Fib% = (depthPrice / legSize) * 100
Zatem jeśli cena cofa się mniej więcej o 38,2%–50% ostatniego impulsu przed kontynuacją wzrostu, zobaczysz wartości bliskie 38,2%, 50%, 61,8% itd.
W trendzie spadkowym
- Noga impulsu biegnie od:
-
- Ceny bazowej trendu = ostatnie istotne maksimum (koniec poprzedniego cofnięcia)
- Ekstremum trendu = ostatnie minimum wahań trendu
- Cofnięcie idzie w górę wbrew trendowi, a wskaźnik mierzy:
-
- Głębokość cofnięcia (cena):
depthPrice = pullbackHigh – trendLow - Wielkość nogi impulsu:
legSize = trendBasePrice – trendLow
- Głębokość cofnięcia (cena):
- Ta sama formuła:
Fib% = (depthPrice / legSize) * 100
W ten sposób każda kropka widoczna na wykresie reprezentuje cofnięcie wewnątrz wyraźnego impulsu bieżącego trendu, wyrażone zarówno w pipach, jak i w procentach Fibonacciego, dzięki czemu możesz szybko ocenić, czy cofnięcie jest płytkie, typowe czy nietypowo głębokie.
Podsumowanie
Key features include:
- Detection of trend direction and pullbacks.
- Measurement of pullback depth and Fibonacci retracement percentage.
- Live tracking of the number of pullbacks, last pullback depth, average pullback depth, and last Fibonacci retracement percentage.
- Visual chart elements such as large green dots at pullback lows in uptrends and large red dots at pullback highs in downtrends.
- Optional compact labels displaying pullback depth and Fibonacci percentage.
- A dynamic legend showing current trend direction, pullback counts, and metrics.
The Fibonacci retracement is calculated based on the last impulse leg, defined by the last significant trend base and extreme prices, providing objective numeric data to assess whether retracements are shallow, typical, or unusually deep. The indicator supports various markets including Forex, indices, commodities, cryptocurrencies, and stocks. It offers configurable parameters such as EMA period, minimum pullback size, breakout buffer, and display options for labels and legend.
Opinie klientów
5 | 50 % | |
4 | 50 % | |
3 | 0 % | |
2 | 0 % | |
1 | 0 % |


![Logo „[Hamster-Coder] Bollinger Bands”](https://cdn.ctrader.com/image/webp/21d8e5d6-fb11-4bac-b9ee-cd05c2b76804_30327)

![Logo „[Stellar Strategies] MARSI Signal Plotter”](https://cdn.ctrader.com/image/webp/7b2b8da6-8f8e-4646-8d4a-4710c516c01e_25567)


