
Opis
Poziomy Liczb Okrągłych - Wskaźnik dla cTrader
Opis
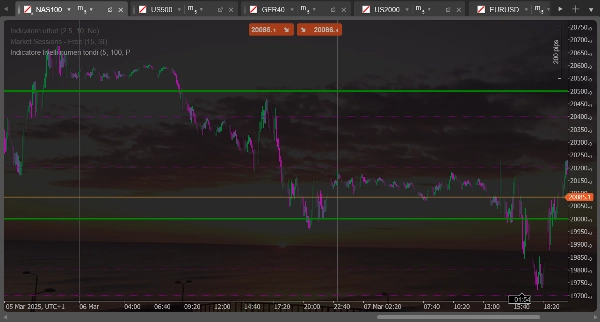
Ten wskaźnik rysuje poziome linie na "okrągłych liczbach" lub poziomach psychologicznie istotnych na wykresie. Jest idealny do identyfikacji potencjalnych obszarów wsparcia i oporu opartych na okrągłych poziomach cen, które często mają znaczenie psychologiczne dla traderów.
Główne funkcje
- Rysuje dwa odrębne zestawy poziomych linii w regularnych odstępach
- Automatycznie oblicza poziomy na podstawie bieżącej ceny zamknięcia
- Aktualizuje się dynamicznie wraz z ruchem ceny
- Oferuje osobną konfigurację dla każdego zestawu linii (kolor, styl, rozmiar)
Możliwe ustawienia
Dla pierwszego zestawu linii (kreskowane)
- Liczba Linii Zestaw 1: Określa, ile linii narysować powyżej i poniżej bieżącej ceny (domyślnie: 5)
- Rozmiar Zakresu Zestaw 1: Ustawia odległość między liniami w pipach (domyślnie: 100 pipów)
- Kolor Linii Zestaw 1: Dostosowuje kolor linii (domyślnie: fioletowy)
- Grubość Linii Zestaw 1: Ustawia grubość linii (domyślnie: 1 piksel)
Dla drugiego zestawu linii (ciągłe)
- Liczba Linii Zestaw 2: Określa, ile linii narysować powyżej i poniżej bieżącej ceny (domyślnie: 2)
- Rozmiar Zakresu Zestaw 2: Ustawia odległość między liniami w pipach (domyślnie: 500 pipów)
- Kolor Linii Zestaw 2: Dostosowuje kolor linii (domyślnie: zielony)
- Grubość Linii Zestaw 2: Ustawia grubość linii (domyślnie: 1 piksel)
Praktyczne zastosowanie
Zazwyczaj pierwszy zestaw (linie kreskowane) służy do identyfikacji mniejszych poziomów psychologicznych, podczas gdy drugi zestaw (linie ciągłe) podkreśla większe poziomy psychologiczne. Na przykład dla EURUSD możesz ustawić pierwszy zestaw, aby pokazywał poziomy co 100 pipów (takie jak 1.0800, 1.0900), a drugi zestaw dla poziomów co 500 pipów (takie jak 1.0500, 1.1000).
Te poziomy często pokrywają się z obszarami wsparcia lub oporu, gdzie cena może odbić się lub zwolnić, zanim kontynuuje swój ruch.
Round Number Levels - Indicator for cTrader
Description
This indicator draws horizontal lines at "round numbers" or psychologically significant levels on the chart. It's ideal for identifying potential support and resistance areas based on round price levels that often have psychological importance for traders.
Main Features
- Draws two distinct sets of horizontal lines at regular intervals
- Automatically calculates levels based on the current closing price
- Updates dynamically as price moves
- Offers separate configuration for each set of lines (color, style, size)
Possible Adjustments
For the first set of lines (dashed)
- Number of Lines Set 1: Determines how many lines to draw above and below the current price (default: 5)
- Range Size Set 1: Sets the distance between lines in pips (default: 100 pips)
- Line Color Set 1: Customizes the color of the lines (default: purple)
- Line Width Set 1: Sets the thickness of the lines (default: 1 pixel)
For the second set of lines (solid)
- Number of Lines Set 2: Determines how many lines to draw above and below the current price (default: 2)
- Range Size Set 2: Sets the distance between lines in pips (default: 500 pips)
- Line Color Set 2: Customizes the color of the lines (default: green)
- Line Width Set 2: Sets the thickness of the lines (default: 1 pixel)
Practical Usage
Typically, the first set (dashed lines) is used to identify minor psychological levels, while the second set (solid lines) highlights major psychological levels. For example, for EURUSD, you might set the first set to show levels every 100 pips (such as 1.0800, 1.0900) and the second set for levels every 500 pips (such as 1.0500, 1.1000).
These levels often coincide with support or resistance zones where price might bounce or slow down before continuing its movement.
Podsumowanie
Opinie klientów
5 | 50 % | |
4 | 50 % | |
3 | 0 % | |
2 | 0 % | |
1 | 0 % |


![Logo „[CB] Pivot Points Pro”](https://cdn.ctrader.com/image/webp/43463c82-67b0-4f10-a4ba-901bba091d81_32594)


