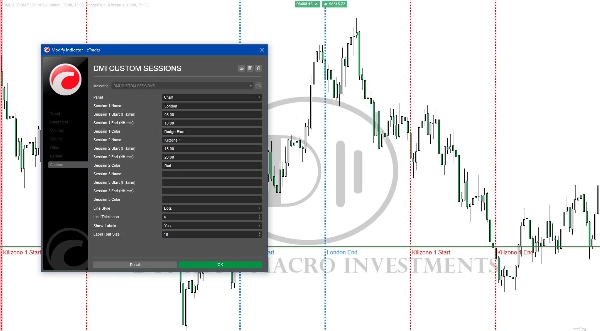
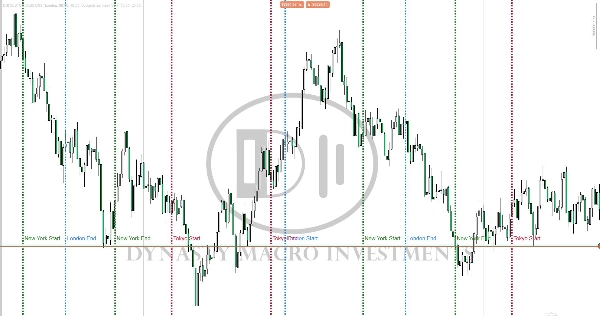
DMI CUSTOM SESSIONS
Logo „DMI CUSTOM SESSIONS”
03/09/2025
Desktop
Since 11/12/2024
Przesłany obraz „DMI CUSTOM SESSIONS”Przesłany obraz „DMI CUSTOM SESSIONS”

This will allow you to have SESSIONS on the chart. London, New York, Asian session and you can customize the times. You can give the session unique names and change the colors.

0.0
Opinie: 0
Opinie klientów
Ten produkt nie ma jeszcze opinii. Wypróbowałeś(-aś) go już? Bądź pierwszy(-a) i powiedz o tym innym!
Więcej od tego autora
DMI 3 bar v2
Shows BUY & SELL signals for 3 & 4 BAR PATTERN (Morning star/ Evening star). It is adjustable and it will SHOW ARROWS.
DMI MONDAY ZONES v2.1
Marks Monday's OPEN,HIGH & LOW. These are areas of support and resistance for the week.
Morning Star On Chart
Morning Star pattern on chart (Bullish and Bearish) automatically marked with (BUY & SELL) Very powerful signals.
Możesz także polubić
Wskaźnik
Indices
Prop
Stocks
+3
LT_Ind_Pivot
Draws pivots (P, S/R, CPR) from selected anchors like H1–Month1, with optional mid-levels (PS1, S1S2, etc.)
Wskaźnik
NAS100
NZDUSD
Breakout
+14
Bollinger Bands Cloud
Visualize Bollinger Bands with a colored cloud for clarity. Enhance your trading precision with this dynamic indicator!
ICT Killzone and Sessions high_low
This indicator is an essential tool for traders seeking to visualize key trading sessions on their charts.
Wskaźnik
Supertrend
Signal
SuperTrend Scanner
Supertrend Scanner – Track trends across assets & timeframes in real-time with alerts. Stay ahead, and trade smarter!
Pivot Points
Pivot Points Indicator
Zigzag T3
Three ZigZag lines
Wskaźnik
Indices
Commodities
Forex
Smart Floating Risk - Premium version
The Floating Risk Indicator is an essential tool for traders who prioritize risk management.
Wskaźnik
NAS100
Indices
Prop
+6
ICT_SMC_ToolKit
institutional-level market analysis
VWAP Tabajara
VWAP Tabajara
Wskaźnik
Indices
RSI
Stocks
+5
REDGREENZONEREVERSAL
The Red & Green Zone Reversal Indicator detects overbought and oversold market conditions using Bollinger Bands and RSI.
Candle Timer & Strength Demo
Candle Timer & Strength DEMO for cTrader This is a DEMO version of the Candle Timer & Strength indicator. You can use al
Wskaźnik
Breakout
AutoLines™ Support & Resistance
FlexSR auto‑detects pivot highs/lows to plot dynamic support & resistance lines Features customizable styling and option
Wskaźnik
RSI
Breakout
XAUUSD
+6
Multi-Asset Performance Matrix
Visual tool tracking financial assets' % performance across timeframes, highlighting trends with color-coded insights.
Wskaźnik
RSI
Breakout
Supertrend
Leverage Liquidation Map
📊 Liquidation Map: Potential areas where highly leveraged investors might face liquidations.
Supertrend TV
REAL Supertrend because default Ctrader Supertrend gives different signals
Breakout Mode Patterns
Brooks price action breakout mode patterns
Wskaźnik
Stocks
Commodities
Forex
buy sell
SmartSignal Pro: Precise BUY/SELL signals to profit in any market. Trade like a pro! 🚀