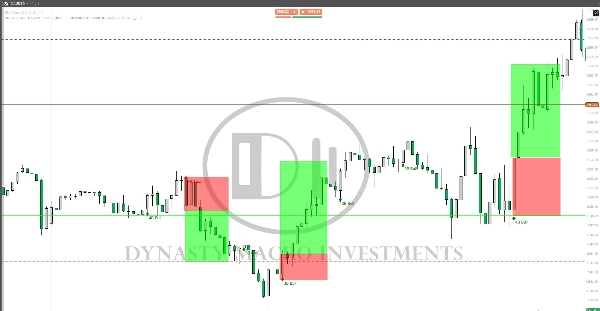
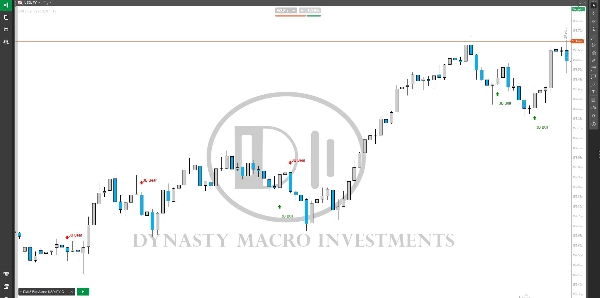
Morning Star On Chart
Logo „Morning Star On Chart”
03/09/2025
Desktop
Since 11/12/2024
Przesłany obraz „Morning Star On Chart”Przesłany obraz „Morning Star On Chart”

Morning Star pattern on chart (Bullish and Bearish) automatically marked with (BUY & SELL) Very powerful signals.

0.0
Opinie: 0
Opinie klientów
Ten produkt nie ma jeszcze opinii. Wypróbowałeś(-aś) go już? Bądź pierwszy(-a) i powiedz o tym innym!
Więcej od tego autora
DMI 3 bar v2
Shows BUY & SELL signals for 3 & 4 BAR PATTERN (Morning star/ Evening star). It is adjustable and it will SHOW ARROWS.
DMI CUSTOM SESSIONS
This will allow you to have SESSIONS on the chart. London, New York, Asian session and you can customize the times.
DMI MONDAY ZONES v2.1
Marks Monday's OPEN,HIGH & LOW. These are areas of support and resistance for the week.
Możesz także polubić
DMI 3 bar v2
Shows BUY & SELL signals for 3 & 4 BAR PATTERN (Morning star/ Evening star). It is adjustable and it will SHOW ARROWS.
Wskaźnik
RSI
Breakout
XAUUSD
+5
Shielded Trend
Buy/Sell signals filtering noise, color-coded trends & strength shield 🛡️. Trade only with POWER ⚡
Wskaźnik
NAS100
NZDUSD
XAUUSD
+11
Volume Profile Pro
Visualize trading volume by price within any range, highlight POC and key value areas.
Wskaźnik
Stocks
Forex
Crypto
PinBarCandlestickPattern
PinBarCandlestickPattern Indicator
TrendStrengthSignals
Edge-aware clouds + Pro HUD: better entries, calmer exits, adaptive risk.
Wskaźnik
Breakout
3 Bar Triangle by Linda Raschke
3 bar triangle = high below 2 day high, low above 2 day low
Wskaźnik
RSI
Signal
MA-RSI HTF Confirmation
MA-RSI HTF Confirmation: Eliminate false signals and trade with confidence!
Wskaźnik
NAS100
RSI
NZDUSD
+19
SMC + FVG Binary Signal Pro
SMC/ICT signals using FVG + liquidity sweep/MSS with EMA-RSI-MACD filters, clear visuals, and actionable alerts.
VegaXLR - RSI and StochRSI Alerts
VegaXLR's cTrader StochRSI identifies overbought/oversold RSI levels for precise trade entries.
Wskaźnik
Signal
MeetAlgo_ChannelTrading_cTrader
Channel Trading is a volatility-based indicator using envelope theory to spot price breakouts and trade signals.
Bars color 1
This is the first version I offer you for free.
Repiptor Candlescope Lite
Candlestick pattern detector lite version
Trend Direction Force Index - TDFI (Alerts)
Spot Strong Trends Early & Filter Market Noise
Najwyżej oceniane
Za darmo
Wskaźnik
Indices
RSI
Signal
Rsi + Volume
This indicator combines RSI (Relative Strength Index) with volume analysis to generate more reliable trading signals.
OHLC PRO by LudwigICT
OHLC PRO – Advanced Session & Market Structure Tool
DMI MONDAY ZONES v2.1
Marks Monday's OPEN,HIGH & LOW. These are areas of support and resistance for the week.
Wskaźnik
Indices
Prop
Stocks
+3
LT_Ind_SRZones
Automatic Support/Resistance zones from swing points.
Wskaźnik
NAS100
NZDUSD
Breakout
+8
Pivot Breakout Detector
🎯 Automatically identify significant breakouts from price consolidation zones.