Opis
Krótki opis
Mapa reżimu trendu i wolumenu to filtr reżimu dla cTrader, który mierzy kierunek i trwałość zarówno ceny, jak i wolumenu. Daje znormalizowany wynik trendu oraz wynik trendu wolumenu w zakresie –10 do +10, koloruje twoje świece płynnym gradientem od niedźwiedziego czerwonego do byczego zielonego oraz pokazuje, czy obecne otoczenie jest ryzykowne, bezpieczne, czy po prostu hałaśliwe.
🧠 Co robi
Ten wskaźnik replikuje logikę „Regime Filter” BigBeluga z TradingView, dostosowaną do cTrader i opakowaną w czytelną mapę reżimu trendu i wolumenu.
Wygładzona cena i wolumen
- Oblicza HLC3 (średnia z High, Low, Close) i stosuje Hull Moving Average (HMA) do wygładzenia ceny.
- Stosuje kolejny Hull Moving Average do wolumenu tickowego.
Wynik trendu (cena)
- Dla ostatnich N świec (
Length) porównuje aktualną HMA ceny z każdą poprzednią wartością HMA:
- Jeśli aktualna HMA > poprzednia HMA → trend +1
- Jeśli aktualna HMA ≤ poprzednia HMA → trend –1
- Zsumowany wynik jest skalowany do –10 … +10 → to jest wartość trendu.
Wynik trendu wolumenu
- Stosuje tę samą logikę, ale do HMA wolumenu.
- Wynik to kolejny znormalizowany wynik w –10 … +10 → to jest wartość wolumenu.
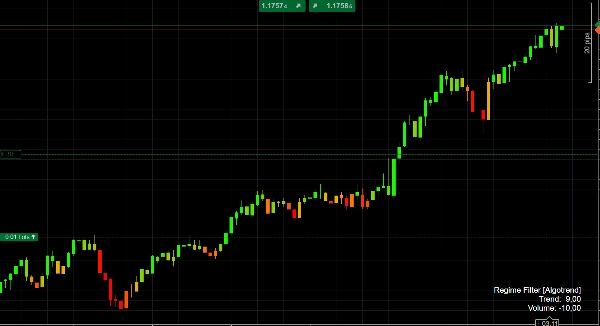
Logika kolorów
- Gdy wynik trendu jest ujemny, świece są kolorowane gradientem czerwony → pomarańczowy w zależności od siły spadkowego reżimu.
- Gdy wynik trendu jest dodatni, świece są kolorowane pomarańczowy → limonkowy, z mocniejszą zielenią dla silniejszych wzrostowych reżimów.
Daje to natychmiastową wizualną wskazówkę, czy ruch cenowy jest niedźwiedzi, neutralny czy byczy oraz jak trwały jest obecny reżim.
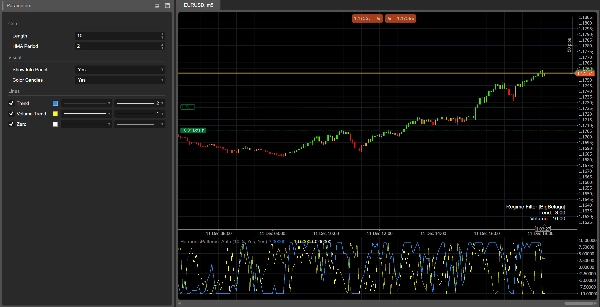
Panel reżimu
W oknie podrzędnym wskaźnik rysuje:
- Linię trendu (niebieska)
- Linię trendu wolumenu (szara)
- Linię zerową (linia bazowa)
Na ostatniej świecy wyświetla mały panel informacyjny z aktualnymi wartościami Trendu i Wolumenu.
🎯 Jak możesz go używać
Potwierdzenie trendu
- Handluj tylko w kierunku silnego reżimu, na przykład:
- Trend > +4 → nastawienie tylko na długie pozycje
- Trend < –4 → nastawienie tylko na krótkie pozycje
Filtr reżimu
- Wyłącz lub zmniejsz skalę swojej strategii, gdy reżim jest słaby (Trend blisko 0) lub gdy trend wolumenu jest silnie ujemny, co często sygnalizuje ruchy niestabilne lub wygasające.
Kontekst dla sygnałów
Połącz swoje istniejące sygnały wejścia (akcja cenowa, wzory harmoniczne, oscylatory itp.) z Mapą reżimu trendu i wolumenu jako filtr makro:
- Bierz pod uwagę tylko wyłamania, gdy Trend jest dodatni, a trend wolumenu również dodatni.
- Unikaj ustawień powrotu do średniej, gdy Trend jest bardzo silny (> +8 lub < –8), ponieważ rynek znajduje się w silnym reżimie kierunkowym.
⚙️ Parametry wejściowe
Podstawowe
Length
Liczba świec używanych do budowy wyników trendu i wolumenu.
- Wyższe wartości → gładszy, bardziej „makro” reżim; wolniejszy w zmianach, ale bardziej stabilny.
- Niższe wartości → szybsza reakcja, ale więcej szumu i częstsze zmiany.
Okres HMA
Okres Hull Moving Average używany do wygładzania zarówno ceny, jak i wolumenu.
- Dopasuj go do swojego interwału czasowego i stylu handlu: krótszy dla niskich interwałów, dłuższy dla wyższych.
Wizualne
Pokaż panel informacyjny
Pokazuje/ukrywa mały panel tekstowy na ostatniej świecy z aktualnymi wynikami Trendu i Wolumenu.Koloruj świece
Włącza kolorowanie świec na podstawie wartości Trendu (gradient czerwony / pomarańczowy / zielony). Wyłącz, jeśli wolisz zachować domyślne kolory wykresu.
✅ Szybka ściąga interpretacyjna
- Trend ≥ +7 → silny byczy reżim, świece jasnozielone.
- Trend między +3 a +7 → bycze nastawienie; cofnięcia to potencjalne strefy do kupna na dołku.
- Trend między –3 a +3 → boczny / niestabilny; sygnały są mniej wiarygodne.
- Trend ≤ –7 → silny niedźwiedzi reżim, świece ciemnoczerwone.
- Trend wolumenu > 0 → rosnąca / utrzymująca się aktywność, ruchy są bardziej prawdopodobne jako „prawdziwe” i trwałe.
- Trend wolumenu < 0 → słabnący udział, wyższe ryzyko fałszywych ruchów, chaosu lub odwróceń.
Podsumowanie
Opinie klientów
5 | 0 % | |
4 | 100 % | |
3 | 0 % | |
2 | 0 % | |
1 | 0 % |


![Logo „[Hamster-Coder] Bollinger Bands”](https://cdn.ctrader.com/image/webp/21d8e5d6-fb11-4bac-b9ee-cd05c2b76804_30327)


