
Opis
VmmSignalAverage PRO w wersji próbnej to kompleksowy wskaźnik handlowy, który łączy wiele systemów analizy technicznej w jedno potężne narzędzie. Wykrywa kluczowe wzorce na wykresie i dostarcza wyraźne sygnały wizualne dla lepszych decyzji handlowych.
GŁÓWNE CECHY:
12 rodzajów średnich kroczących: w tym (Mediana), SMA, EMA, Podwójna EMA, Potrójna EMA, Hull, Szereg czasowy, Trójkątna, VIDYA, Ważona, Wygładzanie Wildera, Adaptacyjna Kaufmana
System sygnałów oparty na ATR: wykorzystuje Average True Range do dynamicznych obliczeń odległości
6 systemów wykrywania wzorców:
Luki wartości godziwej (FVG) z możliwością dostosowania kolorów
Identyfikacja luk cenowych
Wzorce Inside Bar
Sygnały odwrócenia Reverse123
Wzorce knota z konfigurowalnymi proporcjami
Strzałki kierunku trendu
Inteligentny filtr trendu: pokazuje sygnały tylko w kierunku trendu
Optymalizacja wydajności: wbudowany system pamięci podręcznej dla płynnej pracy
Automatyczne czyszczenie: utrzymuje wykres w czystości i porządku
JAK UŻYWAĆ:
Podstawowa konfiguracja:
Dodaj wskaźnik do swojego wykresu
Skonfiguruj typ i okres średniej kroczącej
Włącz/wyłącz wykrywanie wzorców według potrzeb
Sygnały handlowe:
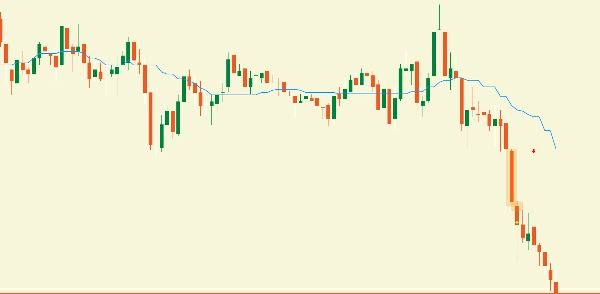
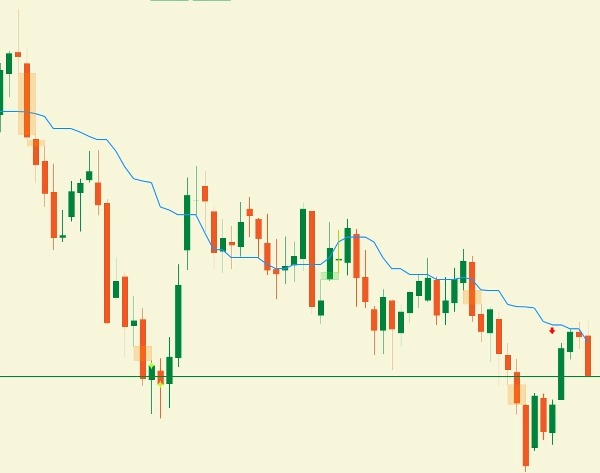
Sygnały bycze: pojawiają się podczas trendów wzrostowych (zielone kółka/gwiazdy)
Sygnały niedźwiedzie: pojawiają się podczas trendów spadkowych (czerwone kółka/gwiazdy)
Obszary FVG: podświetlone prostokąty pokazujące strefy nierównowagi
Luki: oznaczone kolorowymi prostokątami
Inside Bars: wyświetlane z możliwością dostosowania kolorów
Konfiguracja parametrów:
Grupa średnich kroczących:
Typ obliczeń: wybierz spośród 12 typów MA
Okres: okres MA (3-100)
Typ ceny: źródło ceny do obliczeń
Inteligentna cena dla mediany: inteligentny wybór ceny do obliczeń mediany
Ustawienia trendu:
Pokaż strzałki trendu: wyświetlaj strzałki kierunku trendu
Sprawdzenie poprzednich świec: ile świec analizować dla trendu
Ścisłe wykrywanie trendu: stosuj ścisłe lub łagodne zasady trendu
Filtr trendu: 0=Pokaż wszystkie sygnały, 1=Pokaż tylko sygnały zgodne z trendem
Grupy wzorców (FVG, GAP, INSIDEBAR, Reverse123, Wick):
Włącz/Wyłącz: przełącz każdy typ wzorca
Kolory: dostosuj kolory bycze/niedźwiedzie
Przezroczystość: kontroluj przezroczystość podświetleń wzorców
Progi rozmiaru: minimalne rozmiary wzorców w pipsach
Mnożniki ATR: dynamiczna odległość oparta na zmienności rynku
Ustawienia ATR:
Okres ATR: używa tego samego okresu dla obliczeń Average True Range
Użyj ATR: włącz dynamiczną odległość opartą na zmienności
Mnożniki ATR: dostosuj czułość dla różnych wzorców
Czyszczenie wykresu:
Zachowaj ostatnie świece: ile historycznych świec wyświetlać
Automatyczne czyszczenie wykresu: automatyczne usuwanie starych obiektów
KORZYŚCI Z WYDAJNOŚCI:
Optymalizowany system obliczeń zmniejsza zużycie CPU
Inteligentne buforowanie zapobiega zbędnym obliczeniom
Automatyczne czyszczenie utrzymuje wydajność wykresu
Konfigurowalne logowanie wydajności do monitoringu
ZALCANE USTAWIENIA:
Day Trading: okres 20, ścisły trend = false
Swing Trading: okres 50, ścisły trend = true
Scalping: okres 10, ścisły trend = false
WSPARCIE:
W przypadku pytań lub wsparcia prosimy o zapoznanie się z ustawieniami wskaźnika lub kontakt przez cTrader Store.
UWAGA: Jest to narzędzie analizy technicznej. Zawsze stosuj odpowiednie zarządzanie ryzykiem i łącz z innymi metodami analizy przy podejmowaniu decyzji handlowych.
TAGI: rozpoznawanie wzorców, analiza techniczna, sygnały handlowe, średnie kroczące, ATR, FVG, price action, wzorce wykresów, wskaźnik handlowy, narzędzia profesjonalne
***** FUNKCJE WYŁĄCZONE W WERSJI PRÓBNEJ*****
FVG (Luki wartości godziwej): wyłączone (TRIAL_SHOW_FVG = false)
Wzorce Reverse 123: wyłączone (TRIAL_SHOW_REVERSE123 = false)
ATR dla wzorców knota: wyłączone (TRIAL_USE_ATRWick = false)
Rodzaje średnich kroczących: dostępna tylko SMA
Elastyczność okresu: stała na 21
Analiza historyczna: stała na 3 świece
Podsumowanie
Users can customize moving average types, periods, price sources, and pattern detection settings including colors, opacity, and size thresholds. The ATR settings enable dynamic distance calculations based on volatility, enhancing signal accuracy. The tool features automatic chart cleanup to maintain clarity and optimized performance through caching and reduced CPU usage.
Trading signals are visually represented with bullish (green) and bearish (red) markers, along with highlighted pattern zones. Recommended configurations are provided for day trading, swing trading, and scalping. This indicator serves as a comprehensive pattern recognition and signal tool to assist in informed trading decisions when combined with proper risk management.
Opinie klientów
5 | 100 % | |
4 | 0 % | |
3 | 0 % | |
2 | 0 % | |
1 | 0 % |


