Mô tả
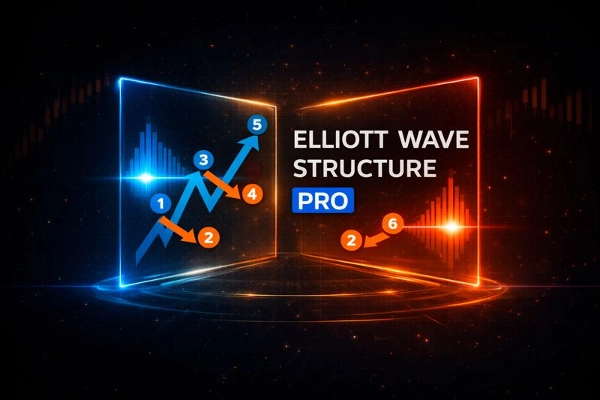
Tiếp diễn Sóng Elliott-3 & Đảo chiều Elliott
Cấu trúc Sóng Elliott là một chỉ báo được thiết kế để phân tích cấu trúc thị trường theo lý thuyết Sóng Elliott.
Nó kết hợp phân tích swing đã được xác nhận, cấu trúc thị trường, phát hiện xung lực Elliott, và một phần riêng biệt dành cho tiếp diễn từ Sóng-2 đến Sóng-3.
Công cụ này được xây dựng dành cho các nhà giao dịch cần sự rõ ràng, xác nhận và thực thi theo quy tắc, không phải vẽ chủ quan.
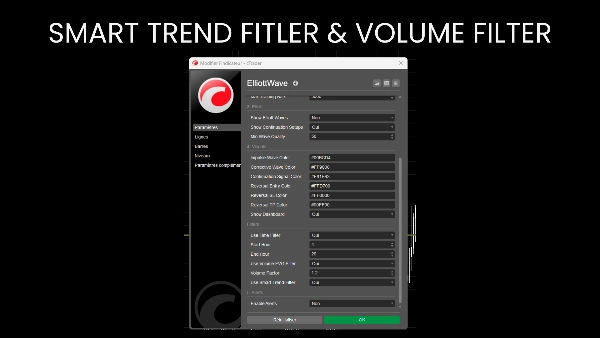
Động cơ Swing không vẽ lại
Tất cả các phép tính dựa trên điểm swing đã được xác nhận sử dụng:
- Độ sâu swing có thể điều chỉnh
- Độ lệch giá tối thiểu (bộ lọc pip)
- Các thanh xác nhận
Khi một swing được in ra, nó không bao giờ di chuyển, đảm bảo độ tin cậy lịch sử đầy đủ.
Phân tích Cấu trúc Thị trường:
Tự động nhận diện và gán nhãn:
- Đỉnh Cao hơn (HH)
- Đáy Cao hơn (HL)
- Đỉnh Thấp hơn (LH)
- Đáy Thấp hơn (LL)
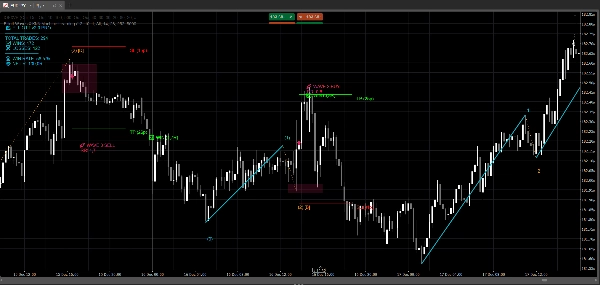
Phát hiện Xung lực Sóng Elliott:
Chỉ báo tự động phát hiện xung lực Elliott 5 sóng hoàn chỉnh theo cả hai hướng:
- Tăng: L-H-L-H-L-H
- Giảm: H-L-H-L-H-L
Nó xác thực các xung lực bằng cách sử dụng các quy tắc nội bộ:
- Sức mạnh Sóng 3
- Logic hồi lại Sóng 2 và Sóng 4
- Tỷ lệ Sóng 5
Mỗi xung lực được đánh giá bằng điểm chất lượng (0–100) và được gán nhãn trực tiếp trên biểu đồ.
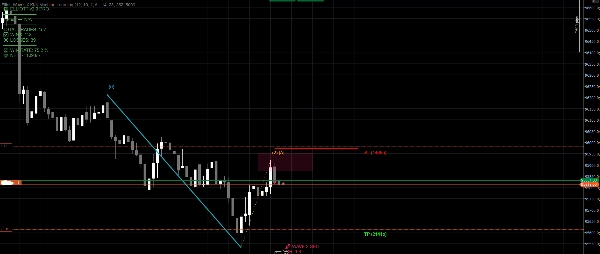
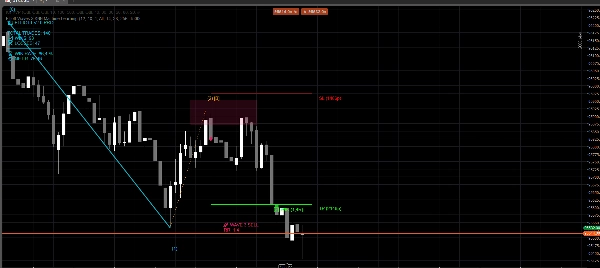
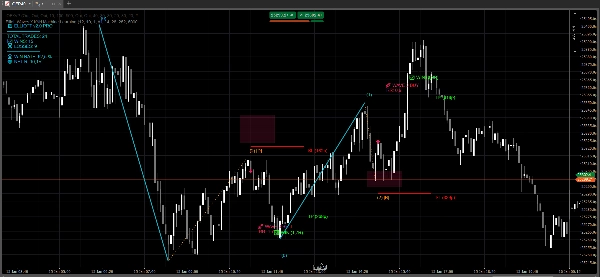
Thiết lập Tiếp diễn Sóng-3 (Mô-đun Giao dịch Chính)
Đây là thành phần giao dịch cốt lõi của chỉ báo.
Hệ thống xác định cấu trúc tiếp diễn Sóng 0-1-2 và chuẩn bị các điểm vào cho Sóng 3:
- Tăng: Đáy → Đỉnh → Đáy Cao hơn
- Giảm: Đỉnh → Đáy → Đỉnh Thấp hơn
Tiêu chí xác thực bao gồm:
- Hồi lại Sóng 2 trong khoảng 23,6% đến 88,6%
- Không bị vô hiệu hóa qua Sóng 0
- Căn chỉnh xu hướng sử dụng cấu trúc thị trường
- Sức mạnh Sóng 1 so với ATR
- Giá phải nằm trên OB
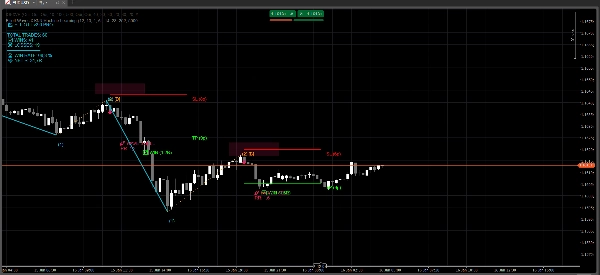
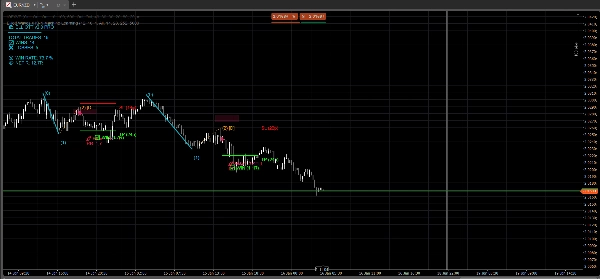
Khi được xác thực, chỉ báo tự động vẽ:
- Cấu trúc Sóng 1 và Sóng 2
- Vùng vào OB
- Tín hiệu vào lệnh
- Dừng lỗ dựa trên ATR vượt qua Sóng 2
- Chốt lời dựa trên dự báo ATR
Quản lý Rủi ro & Giao dịch
- Dừng lỗ và Chốt lời được tính toán động bằng cách sử dụng ATR
- Tỷ lệ Rủi ro-Lợi nhuận được hiển thị trực tiếp trên biểu đồ
- Thiết kế để tránh các thiết lập quá mức hoặc chất lượng thấp
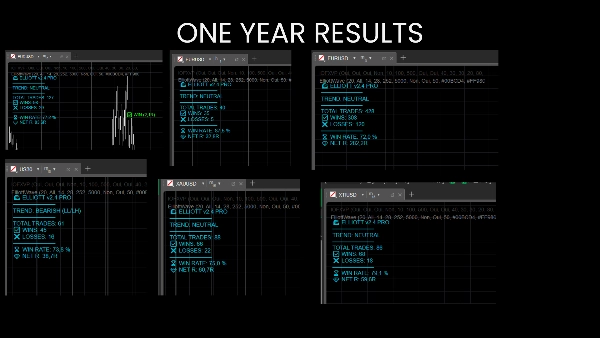
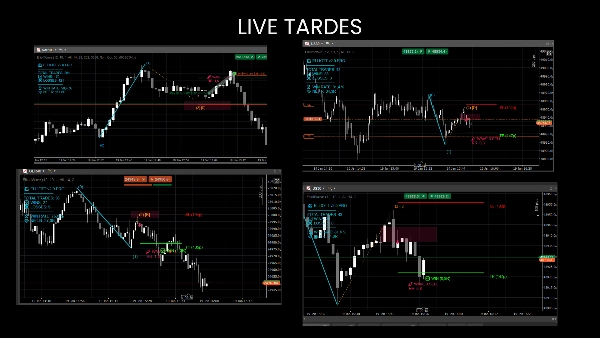
Tôi cá nhân sử dụng nó để scalping các chỉ số trên M1 & M5, nhưng nó cũng hoạt động với FX, hàng hóa, cổ phiếu, v.v... Bảng điều khiển hiển thị nếu nó đã có lợi nhuận trên một tài sản cụ thể.
Phiên bản miễn phí cho phép bạn thử trên FX chính M15.