
Opis
Wolfe Wave Pro to wskaźnik zaprojektowany do automatycznego wykrywania, weryfikacji i wizualizacji wzorców Wolfe Wave w czasie rzeczywistym, z panelem wydajności.
Stworzony głównie dla rynku Forex, to narzędzie przekształca tradycyjnie subiektywny wzorzec w ustrukturyzowane, oparte na zasadach podejście.
Podstawowa koncepcja
Wolfe Wave to naturalny wzorzec struktury rynku oparty na:
- symetrii cen,
- zbiegających się liniach trendu,
- oraz dynamice powrotu do średniej.
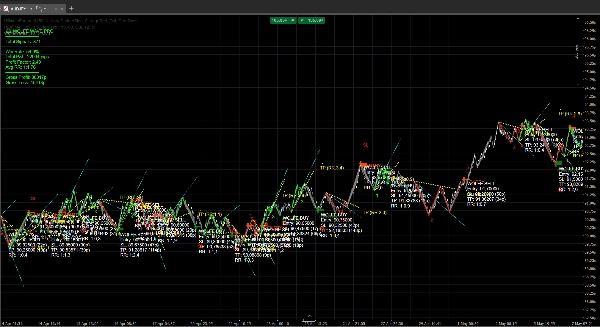
Wolfe Wave Pro automatyzuje ten proces poprzez:
- Identyfikację punktów zwrotnych za pomocą adaptacyjnego silnika ZigZag
- Weryfikację byczych i niedźwiedzich 5-punktowych struktur Wolfe Wave
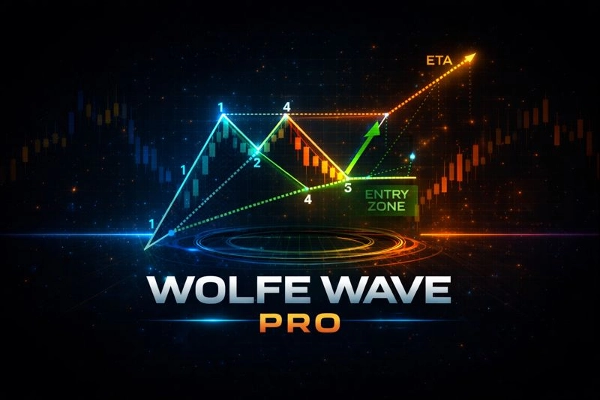
- Projekcję poziomów wejścia, stop loss i celu (ETA)
- Śledzenie metryk wydajności na żywo w panelu
Bez zgadywania. Bez ręcznego rysowania. Bez wzorców z retrospekcji.
Kluczowe cechy
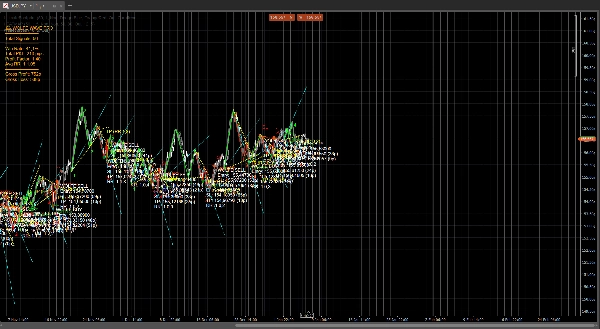
🔹 Automatyczne wykrywanie Wolfe Wave
- Wykrywa bycze i niedźwiedzie Wolfe Wave na podstawie struktury swingów
- Używa konfigurowalnej głębokości i odchylenia ZigZag, aby dostosować się do różnych warunków rynkowych
- Filtruje nieprawidłowe lub niskiej jakości struktury za pomocą reguł opartych na cenie
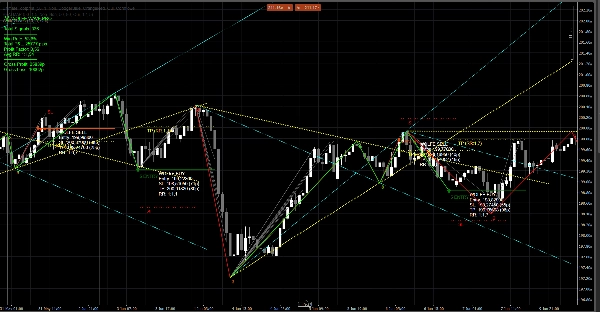
🔹 Kompletny system handlowy
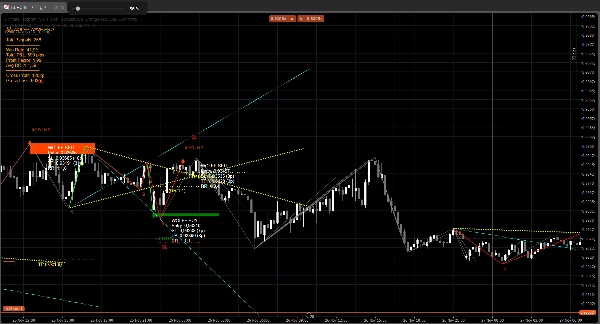
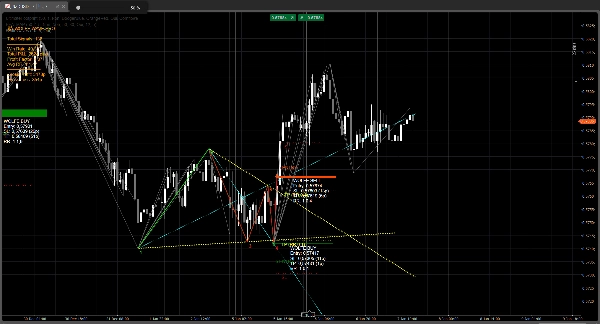
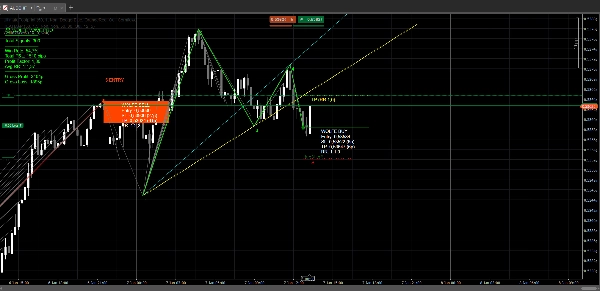
Dla każdej zweryfikowanej Wolfe Wave wskaźnik automatycznie wyświetla:
- Oznaczenie punktów 1–5
- Strefę wejścia wokół punktu 5
- Stop Loss (oparty na strukturze)
- Projekcję celu (linia ETA)
- Obliczenie stosunku ryzyka do zysku (RR)
- Strzałkę wejścia dla przejrzystości wizualnej
Wszystko jest rysowane bezpośrednio na wykresie dla natychmiastowej realizacji.
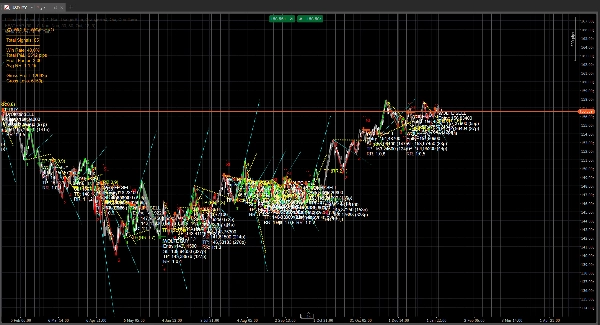
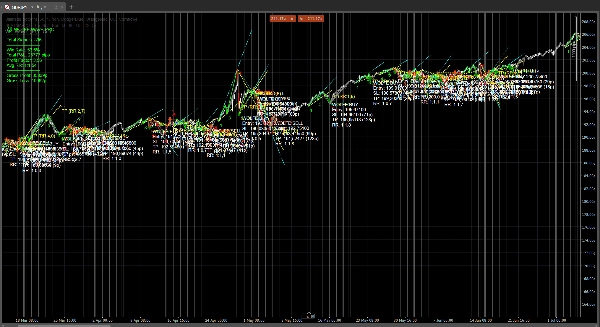
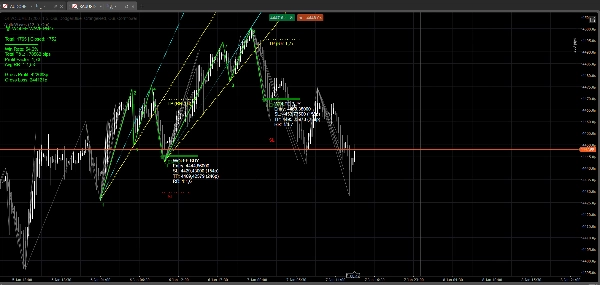
Panel wydajności (wbudowany)
Wolfe Wave Pro zawiera na żywo panel statystyk, śledzący:
- Łączną liczbę wykrytych sygnałów
- Wskaźnik wygranych
- Łączny zysk/strata (w pipsach)
- Współczynnik zysku
- Średni stosunek ryzyka do zysku
- Zysk brutto i strata brutto
- Status otwartych / wygranych / przegranych transakcji
To pozwala obiektywnie ocenić zachowanie Wolfe Wave na różnych parach i ramach czasowych. Proszę pamiętać, że Wolfe Wave nie są odpowiednie dla każdego aktywa. Niektóre są bardziej reaktywne niż inne. Ogólnie rzecz biorąc, pary FX są
Przeznaczone dla
- Traderów Forex
- Standardowych, Renko i Heiken Ashi wykresów
- Obsługa wielu ram czasowych (od M1 dla płynnych aktywów do H4)
- Traderów ceniących strukturę, geometrię i asymetrię ryzyka
- Użytkowników poszukujących systemów opartych na wzorcach ze statystykami, a nie tylko rysunków
Uwagi techniczne
- Wzorce wykrywane są za pomocą punktów zwrotnych
- Linie i strefy aktualizują się w czasie rzeczywistym wraz z rozwojem ceny
- Panel aktualizuje się dynamicznie na podstawie interakcji ceny z prognozowanymi poziomami SL/TP
- Statystyki wydajności są orientacyjne i do analizy
Dostosowanie
- Regulowana czułość ZigZag
- Opcjonalny wyświetlacz panelu
Zastrzeżenie
Ten wskaźnik jest narzędziem wspomagającym podejmowanie decyzji, a nie usługą sygnałów handlowych ani poradą finansową. Wolfe Wave mają charakter probabilistyczny i wymagają odpowiedniego zarządzania ryzykiem.


