

MACD Plus
Wskaźnik
594 pobrania
Wersja 1.0, Oct 2025
Windows, Mac
5.0
Opinie: 2
Od 02/10/2025
2.42K
Bezpłatne instalacje
Opis
Nazwa wskaźnika: Beautiful MACD – wersja zaawansowana
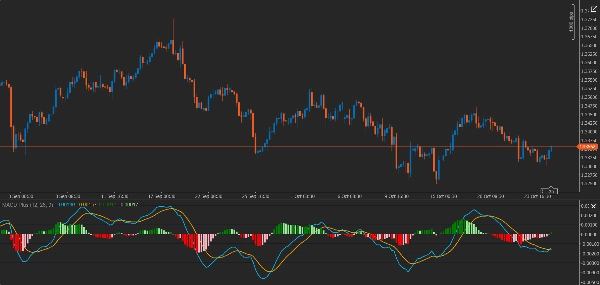
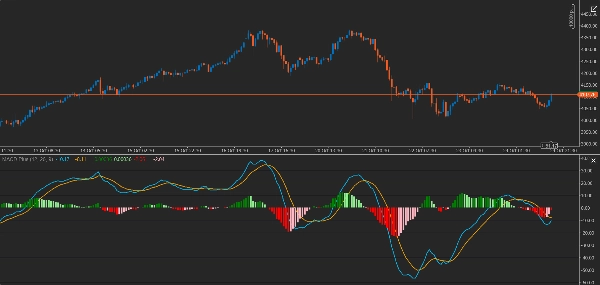
Beautiful MACD to zaawansowana wersja klasycznego wskaźnika MACD z atrakcyjnymi wizualnie funkcjami ułatwiającymi analizę trendów rynkowych.
Funkcje:
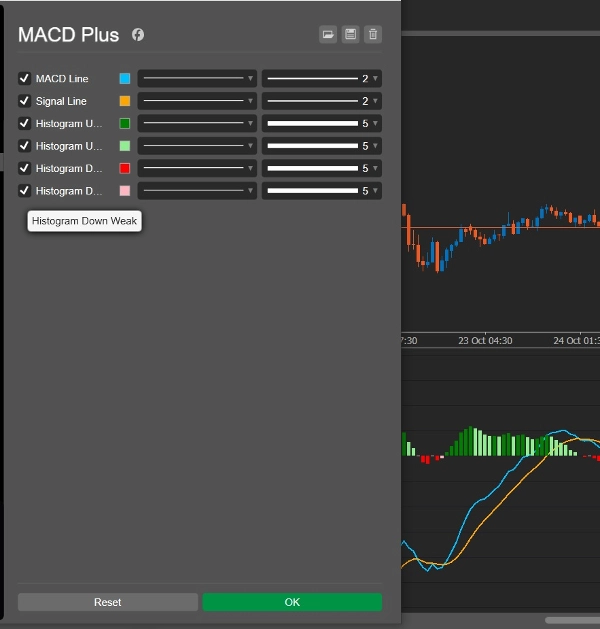
- Linie MACD i sygnału z możliwością dostosowania kolorów i grubości
- Cztery typy histogramów wskazujące siłę momentum:
-
- Histogram Up Strong – Silny ruch w górę
- Histogram Up Weak – Słaby ruch w górę
- Histogram Down Strong – Silny ruch w dół
- Histogram Down Weak – Słaby ruch w dół
- Łatwa wizualna analiza sygnałów wejścia i wyjścia
- Odpowiedni dla wszystkich interwałów czasowych i klas aktywów
Zastosowania:
- Identyfikacja zmian siły trendu
- Wykrywanie optymalnych punktów wejścia i wyjścia
- Idealny dla analityków technicznych i skalperów
-*-*-*-*-*-*-*-*-*-*-*-*-*-*-*-*-*-*-*-*-*-*-*-*-*-*-*-*-*-*-*-*-*-*-*-*-
نام اندیکاتور: Beautiful MACD – نسخه پیشرفته
توضیح کامل:
اندیکاتور Beautiful MACD نسخه ارتقاء یافته کلاسیک MACD است که با ویژگیهای بصری جذاب، تحلیل روند و قدرت حرکت بازار را آسانتر میکند.
ویژگیها:
- دو خط اصلی MACD و Signal با رنگهای متفاوت و ضخامت قابل تنظیم
- چهار نوع هیستوگرام برای نشان دادن قدرت حرکت:
-
- Histogram Up Strong: صعود قوی
- Histogram Up Weak: صعود ضعیف
- Histogram Down Strong: نزول قوی
- Histogram Down Weak: نزول ضعیف
- تحلیل بصری ساده برای تشخیص سیگنالهای ورود و خروج
- مناسب برای تمامی تایمفریمها و انواع داراییها
کاربرد:
- تشخیص تغییرات قدرت روند
- تشخیص نقاط ورود و خروج بهینه
- مناسب برای تحلیلگران تکنیکال و اسکالپرها
Podsumowanie
Podsumowanie AI
MACD Plus is an enhanced version of the classic MACD (Moving Average Convergence Divergence) indicator designed to facilitate market trend analysis through improved visual features. It displays MACD and Signal lines with customizable colors and thickness, alongside four distinct histogram types that represent momentum strength: strong upward, weak upward, strong downward, and weak downward movements. This visual differentiation aids in identifying changes in trend strength and supports easier interpretation of entry and exit signals. The indicator is suitable for all timeframes and asset classes, making it applicable across various markets including Forex and cryptocurrencies. It is particularly useful for technical analysts and scalpers seeking to detect optimal trading points and assess momentum dynamics.
Profil wskaźnika
Dyskusja
Opinie klientów
5.0
Opinie: 2
5 | 100 % | |
4 | 0 % | |
3 | 0 % | |
2 | 0 % | |
1 | 0 % |
Opinie klientów
February 6, 2026
i love this macd its shows straight the coulours i need and for free i cant thank the maker enough up trend nice green down trend nice red love this one thank you for this indicator
Częste pytania
Forex
Signal
Breakout
Crypto
MACD
Produkty dostępne za pośrednictwem cTrader Store, w tym boty handlowe, wskaźniki i wtyczki, dostarczane są przez deweloperów zewnętrznych i udostępniane wyłącznie w celach informacyjnych oraz w celu zapewnienia dostępu technicznego. cTrader Store nie jest brokerem i nie zapewnia doradztwa inwestycyjnego, nie udziela spersonalizowanych rekomendacji ani nie gwarantuje przyszłych wyników.
Więcej od tego autora














Cena
Od 02/10/2025
2.42K
Bezpłatne instalacje