
Opis
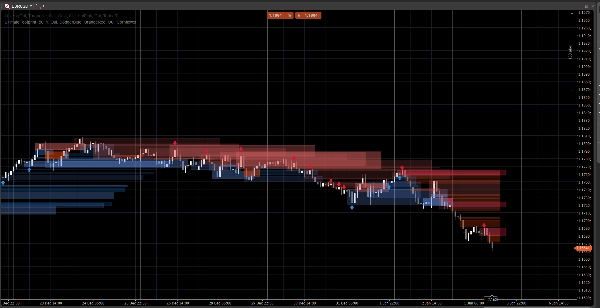
Czysty system struktury rynku, który wyświetla luki cenowe, bloki zleceń oraz sygnały oparte na wybiciach, z opcjonalnym potwierdzeniem wolumenu i alertami retestu. Stworzony dla przejrzystości zarówno na standardowych wykresach, jak i Renko.
Ten wskaźnik skupia się na czytelności i wykonaniu, a nie na zagraceniu. Strefy są rozszerzane do przodu i automatycznie zarządzane (wygasanie / unieważnienie), pomagając śledzić istotne poziomy podczas rozwoju ceny.
Co wykrywa
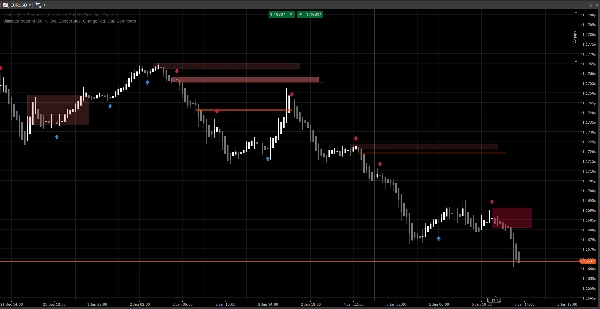
Luki cenowe (niewydolności 3-słupkowe)
- Podkreśla bycze i niedźwiedzie luki bezpośrednio na wykresie
- Opcjonalny wyświetlacz (przełącznik włącz/wyłącz)
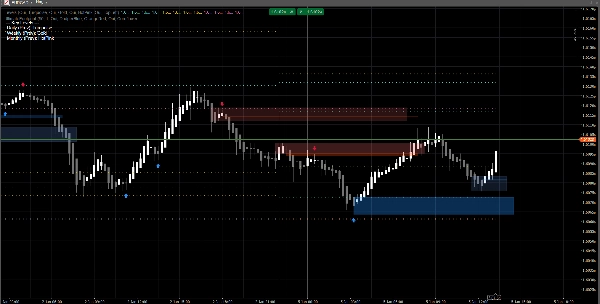
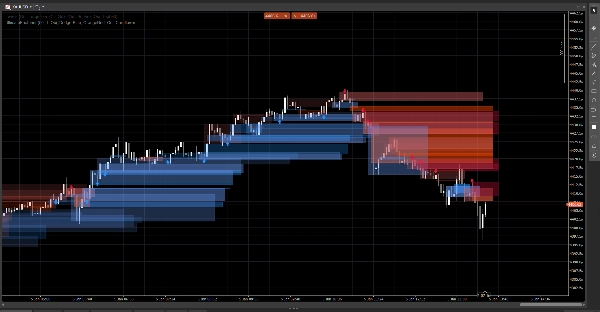
Bloki zleceń (ostatnia przeciwna świeca przed przemieszczeniem)
- Bycze i niedźwiedzie strefy OB
- Automatycznie rozszerzane do przodu aż do unieważnienia / osiągnięcia maksymalnego rozszerzenia
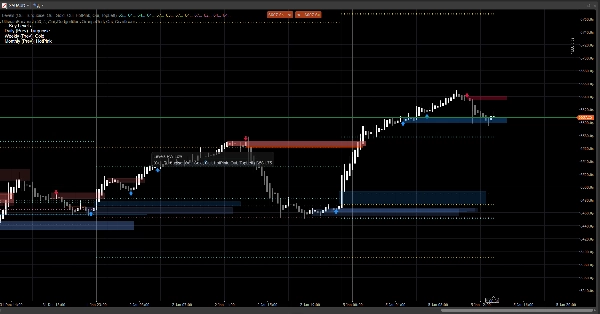
Sygnały przerwania struktury (logika wybicia swing)
- Wykrywanie oparte na wybiciach z użyciem swingowych maksimów/minimów
- Drukuje strzałki sygnałowe (góra/dół) gdy nowy blok zleceń zostanie potwierdzony
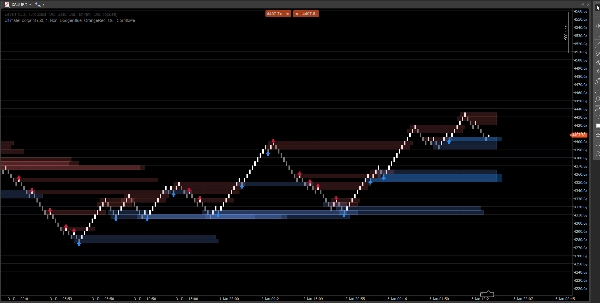
Aktualizacje w czasie rzeczywistym
- Zaprojektowany, aby płynnie aktualizować się w warunkach na żywo
- Działa na klasycznych świecach i dobrze zachowuje się na cenowym ruchu w stylu Renko
Inteligentne filtrowanie (opcjonalne)
Potwierdzenie wolumenu
- Możesz wymagać potwierdzenia Z-score wolumenu przed zatwierdzeniem sygnału bloku zleceń
- Regulowana linia bazowa i czułość
Alerty (opcjonalne)
Włącz alerty dla:
- Wykryto nowy blok zleceń
- Retest bloku zleceń z kierunkiem (świeca odrzucenia)
Jak go używać (prosty przepływ pracy)
- Użyj luk cenowych i bloków zleceń jako stref reakcji (obszary zainteresowania).
- Pozwól sygnałom podkreślić przerwania struktury i odpowiadającą formację OB.
- Użyj alertów retestu, aby złapać powroty do strefy z zachowaniem odrzucenia.
- Połącz z własnymi wejściami/wyjściami (zarządzanie ryzykiem pozostaje Twoje).
Przegląd ustawień
Logika wolumenu
- Linia bazowa wolumenu: okres wygładzania używany do obliczeń Z-score
- Czułość wolumenu: kontroluje, jak silnie wolumen wpływa na widoczność strefy
Luki cenowe
- Pokaż luki cenowe
- Kolory luk byczych / niedźwiedzich
Bloki zleceń
- Pokaż OB
- Kolory byczych / niedźwiedzich OB
- Maksymalne rozszerzenie: jak daleko strefy są rozszerzane do przodu
Sygnały
- Pokaż strzałki
- Okno retrospekcji swing: definiuje okno wykrywania swingów
- Wymagaj potwierdzenia wolumenu (opcjonalne)
- Próg wolumenu + Okres wolumenu
- Kolory sygnałów
- Przezroczystość strefy
- Maksymalna liczba słupków rozszerzenia (sygnały)
Alerty
- Włącz alerty
- Alert nowego OB
- Alert retestu
FAQ
1) Czy wskaźnik się przerysowuje?
Nie.
Wskaźnik nie „przesuwa” historycznych sygnałów na nowe miejsca po zamknięciu słupka.
- Strefy (luki / prostokąty OB) są tworzone na podstawie historycznych słupków, a następnie rozszerzane do przodu.
- Sygnały (strzałki) są potwierdzane na podstawie warunków zamkniętego słupka (przerwanie swing + wybór OB).
Po wydrukowaniu strzałki nie jest ona przenoszona wstecznie.
Ważny niuans (normalne zachowanie):
Podczas gdy bieżący słupek nadal się formuje, ceny (High/Low/Close) mogą się zmieniać. Może to powodować:
- strefa może aktualizować swoje rozszerzenie prawej krawędzi (wizualne rozszerzenie),
- warunek retestu może być tymczasowo prawdziwy, a potem fałszywy na tym samym formującym się słupku.
To nie jest przerysowywaniem — to aktualizacja w czasie rzeczywistym na niedokończonej świecy.
2) Jaka jest różnica między „przerysowaniem” a „przerysowaniem” tutaj?
Przerysowanie = tak (z założenia).
Przerysowanie = nie.
- Przerysowanie oznacza, że prostokąty są ponownie rysowane/rozszerzane na wykresie, aby strefa nadal projektowała się w przyszłość. Jest to wymagane dla nakładki w stylu „odcisku stopy” na żywo.
- Przerysowanie oznaczałoby, że wskaźnik zmienia potwierdzone sygnały z przeszłości (strzałki/strefy) po fakcie. To nie ma miejsca.
3) Dlaczego strefy czasami zmieniają kształt lub przezroczystość?
Ponieważ strefy są ważone wolumenem za pomocą modelu Z-score:
SMA(wolumen)+StdDev(wolumen)w okresie bazowym- przezroczystość/alpha skaluje się z odchyleniem wolumenu
Więc jeśli zmienisz:
- Linię bazową wolumenu
- Czułość wolumenu
- lub źródło symbolu się różni
Intensywność wizualna może się różnić. Lokalizacja strefy pozostaje oparta na cenie; widoczność może odzwierciedlać kontekst wolumenu.
4) Dlaczego niektóre alerty czasami „brakują” lub są „wyłączone”?
Istnieją 3 techniczne powody i wszystkie są celowe:
A) Alerty wymagają ścisłego warunku zbieżności
Dla alertu retestu wskaźnik wymaga:
- cena nakłada się na strefę OB, ORAZ
- spełniony jest warunek świecy odrzucenia (np. bycze odrzucenie wymaga
Zamknięcie > Otwarcie)
Jeśli cena dotyka strefy, ale zamyka się neutralnie / przeciwnie, alert retestu nie jest wyzwalany.
B) Logika alertu jednorazowego (antyspam)
Każdy OB ma wewnętrzną flagę (np. Alerted), dzięki czemu nie otrzymujesz powtarzających się alertów na każdym ticku.
Więc jeśli pierwsze dotknięcie nie spełniło reguły odrzucenia, a później spełnia, ale flaga została już ustawiona (w zależności od wersji), może się wydawać, że jest „wyłączony”.
C) Zachowanie typu wykresu (Renko / agregacja ticków)
Na Renko „bieżący klocek” nie jest klasyczną świecą. Podczas formowania:
- Otwarcie/Zamknięcie mogą być niestabilne lub równe
- logika retestu może zachodzić wewnątrz słupka, ale nie potwierdzać się przy zamknięciu
W handlu na żywo, dla maksymalnej niezawodności:
- Alerty nowych OB są zwykle czyste
- Alerty retestu najlepiej traktować jako alerty „potwierdzonego odrzucenia” (nie tylko dotknięcia knota)
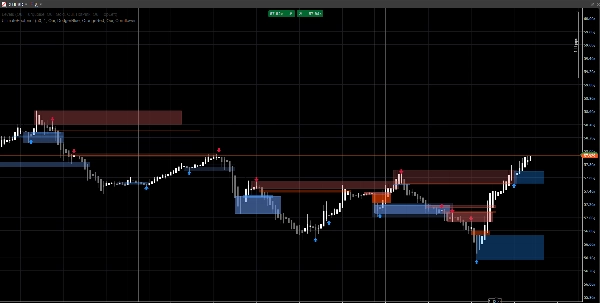
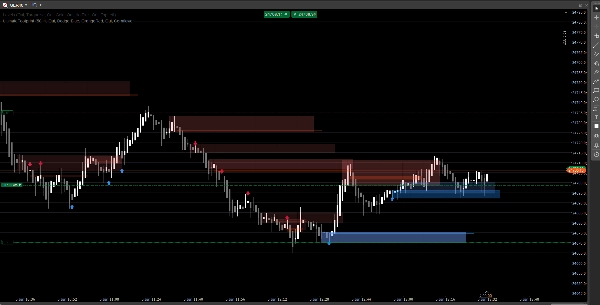
5) Na zrzucie ekranu: dlaczego niektóre OB nie pokazują strzałki (lub dlaczego strzałka nie pasuje do każdego OB)?
Ponieważ strefy i strzałki nie są tym samym mechanizmem:
- Strefy (prostokąty OB) mogą być wyświetlane na podstawie logiki wykrywania stref (OB pochodzące z luk / strefy ruchu cenowego).
- Strzałki są drukowane tylko wtedy, gdy wykryty zostanie zdarzenie strukturalne:
-
- złamany jest swingowy szczyt/dno (Break of Structure),
- następnie algorytm szuka wstecz, aby znaleźć ostatnią przeciwną świecę = ważny OB.
Dlatego możesz zobaczyć strefę OB bez strzałki, jeśli:
- nie było zatwierdzonego przerwania swing,
- kandydat OB nie spełnił filtra wolumenu (jeśli jest włączony),
- lub jest to strefa utworzona przez mechanizm luk, ale nie potwierdzona przez mechanizm struktury.
Właśnie dlatego narzędzie jest przydatne:
Strefy dają mapę. Strzałki podkreślają momenty o najwyższej zbieżności.
6) Czy mogę wymusić, aby OB zawsze pasowały do strzałek?
Tak, technicznie możesz uruchomić go w trybie „tylko sygnały”, wyłączając warstwę strefy, której nie chcesz:
- Wyłącz luki cenowe, jeśli chcesz tylko strefy oparte na strukturze
- Wyłącz Pokaż OB (strefy), jeśli chcesz tylko OB potwierdzone strzałkami
7) Czy działa na wszystkich interwałach i symbolach?
Tak, ale wyniki zależą od:
- zmienności,
- płynności,
- jakości wolumenu ticków,
- oraz sesji rynkowej.
Kryptowaluty i indeksy zachowują się inaczej niż FX.
Uwagi i zastrzeżenia
Ten wskaźnik to wizualne narzędzie wspomagające decyzje, a nie usługa sygnałowa i nie jest poradą finansową.
Wszystkie rynki i interwały zachowują się inaczej — zawsze weryfikuj na swoich danych i odpowiednio zarządzaj ryzykiem. Przeszłe zachowanie nie gwarantuje przyszłych wyników.
Podsumowanie
Opinie klientów
5 | 100 % | |
4 | 0 % | |
3 | 0 % | |
2 | 0 % | |
1 | 0 % |