
说明
Meravith Auto 是 Meravith 手动交易系统的自动化版本。
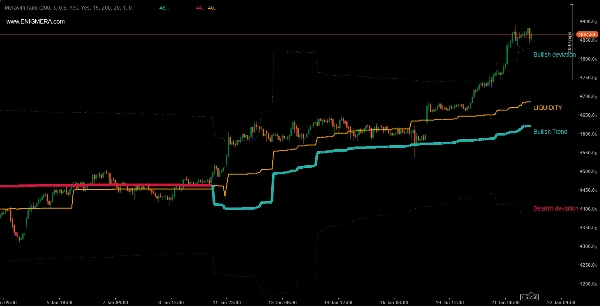
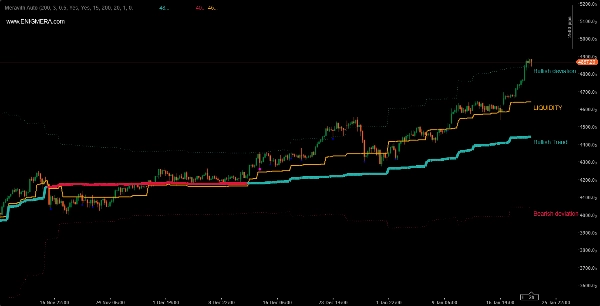
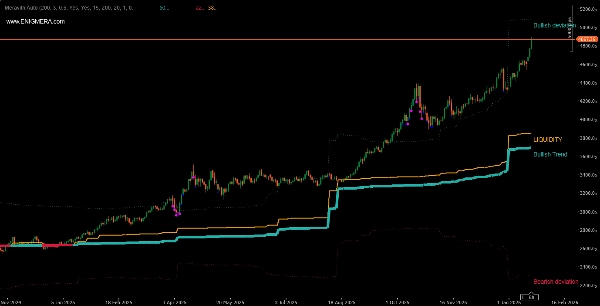
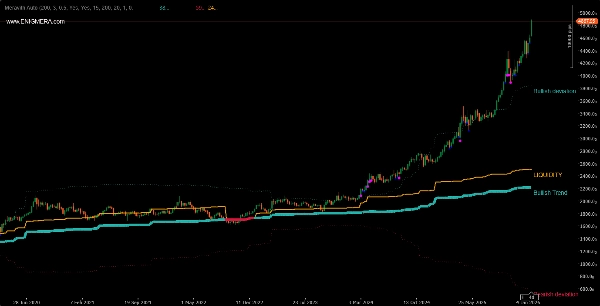
该指标包括:
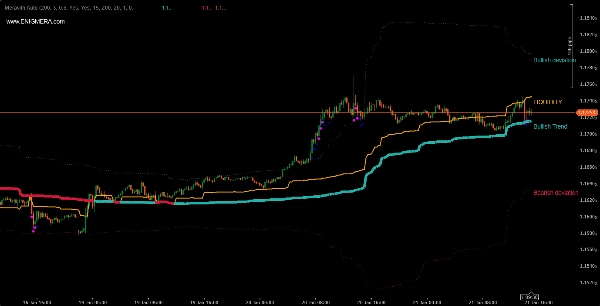
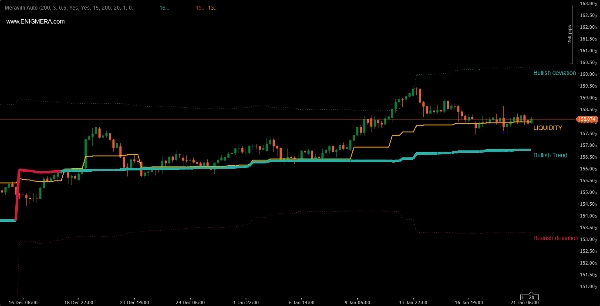
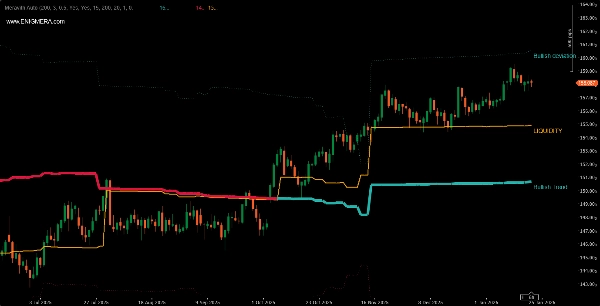
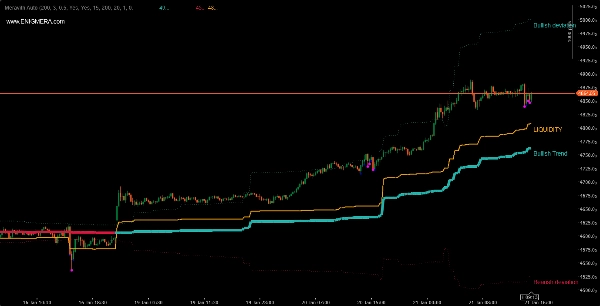
- 趋势线,其颜色会变化。看涨时为绿色,看跌时为红色。这是趋势支撑线。
- 流动性线,表示看涨量等于看跌量。
- 三重看涨偏差线。
- 三重看跌偏差线。
- 紫色和蓝色点表示高成交量。紫色点表示成交量比平均成交量高出两个偏差,蓝色点表示两个偏差。
如何使用?
- 看涨趋势线加上趋势线之上的流动性等于看涨趋势。我们预期市场将向上移动。我们开多仓。
- 看跌趋势线加上趋势线之下的流动性等于看跌趋势。我们预期市场将向下移动。我们开空仓。
可根据您的判断与其他指标结合使用。
它可以用于任何货币对和任何时间框架。
由于不同经纪商报价的成交量不同,您可能会看到不同的结果。
由于成交量较大,较大的经纪商更为理想。
自动版本和手动版本有什么区别?
- 在手动版本中,我们基于高点和低点进行趋势评估。因此,它还提供市场成交量耗尽的水平。
- 在自动版本中,我们有一个在不同市场阶段变化的周期。它可以变化,在高波动期间较短,在低波动期间较长。这里没有耗尽水平,因为不是分析趋势,而是分析周期。这就是我们有偏差的原因。默认显示三重偏差。
摘要
指标配置
客户评价
0.0
评价:0
客户评价
该产品尚无评价。已经试过了?抢先告诉其他人!
讨论
常见问答
BTCUSD
Forex
Signal
Breakout
Indices
EURUSD
Commodities
GBPUSD
NZDUSD
Prop
Scalping
Crypto
Stocks
XAUUSD
NAS100
USDJPY
VWAP
cTrader Store 提供的所有产品,包括交易机器人、指标和插件,均由第三方开发者提供,仅供信息参考和技术访问之用。cTrader Store 并非经纪商,不提供投资建议、个人推荐或任何未来业绩保证。


价格
注册日期 24/10/2025