
Opis
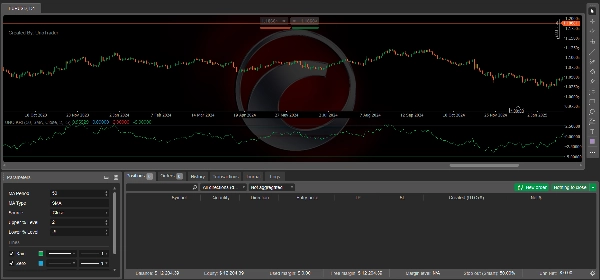
UNO KRI to potężny oscylator oparty na odchyleniach, który mierzy procentową odległość między ceną a wybraną średnią kroczącą. Pomaga traderom identyfikować 📈 stany wykupienia i wyprzedania, 🎯 cofnięcia trendu oraz 🔄 nadmierne rozszerzenia ceny z dużą elastycznością.
W przeciwieństwie do tradycyjnych wskaźników momentum, KRI UNO skupia się wyłącznie na tym, jak daleko cena oddaliła się od swojej wartości średniej, co czyni go bardzo skutecznym w strategiach opartych na powrocie do średniej i cofnięciach trendu na wszystkich rynkach.
🔢 Wzór
$$KRI = \frac{\text{Price} - \text{Moving Average}}{\text{Moving Average}} \times 100$$
Wynik przedstawia procentowe odchylenie ceny od wybranej średniej kroczącej.
🔧 Funkcje
• Obsługuje 10 typów średnich kroczących: SMA, EMA, WMA, WWMA (Wilder), VIDYA (adaptacyjna), ZLEMA (Zero-Lag), TSF (prognoza regresji liniowej), HMA (Hull), VWMA (ważona wolumenem), TMA (trójkątna)
• Konfigurowalny okres MA i regulowane poziomy wykupienia/wyprzedania
• Działa z dowolnym źródłem ceny (Close, Open, High, Low itp.)
• Wyraźna linia zerowa jako odniesienie do biasu trendu
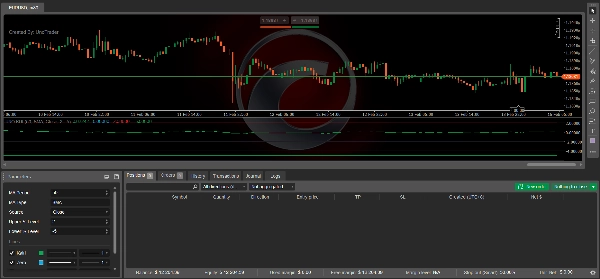
📈 Jak to działa
• Powyżej 0 → Cena handluje powyżej MA (bias wzrostowy)
• Poniżej 0 → Cena handluje poniżej MA (bias spadkowy)
• Powyżej górnego poziomu → Potencjalny stan wykupienia
• Poniżej dolnego poziomu → Potencjalny stan wyprzedania
Podczas silnych trendów wskaźnik może pozostać rozszerzony, potwierdzając siłę trendu, a nie sygnalizując natychmiastowe odwrócenie.
🎯 Zalety
✔ Bardzo elastyczny z 10 typami MA dla różnych stylów handlu
✔ Przydatny zarówno w strategiach powrotu do średniej, jak i cofnięć trendu
✔ Obliczenia procentowe zapewniają spójność na wszystkich instrumentach
✔ Pomaga wcześnie wykrywać nadmiernie rozszerzone warunki rynkowe
✔ Dobrze współpracuje z filtrami trendu i analizą price action
💡 Najlepsze zastosowanie
• Identyfikacja cofnięć na rynkach trendowych
• Wykrywanie stanów wykupienia/wyprzedania na rynkach bocznych
• Potwierdzanie biasu trendu względem średniej kroczącej
• Budowanie zautomatyzowanych strategii handlowych (cBotów)
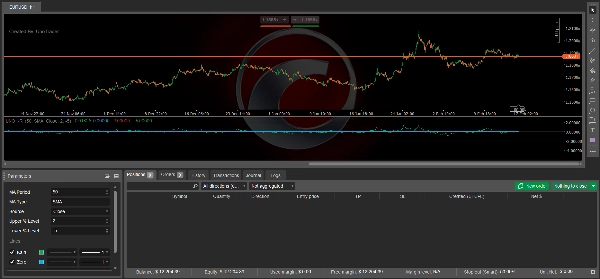
⚙️ Konfiguracja parametrów:
Porada: Ustaw parametr, klikając ikonę folderu, a następnie wybierz pobrany plik.
Link do parametru: Proszę sprawdzić film na YouTube i przejść do opisu, aby zobaczyć link do parametru.
💡 Wskazówki dotyczące użytkowania
🔹 Skalpowanie: Długość 10–30, HMA/ZLEMA, poziomy ±2–3
🔹 Swing Trading: Długość 50–100, SMA/EMA/TMA, poziomy ±5–10
🔹 Potwierdzenie trendu: Obserwuj, czy Kairi pozostaje powyżej 0 (trend wzrostowy) lub poniżej 0 (trend spadkowy)
✅ Podsumowanie i rekomendacje
Najlepsze rynki: główne pary Forex i złoto (płynne, przewidywalne trendy)
Rynki drugorzędne: indeksy i kryptowaluty (stosuj szersze progi ze względu na wysoką zmienność)
💡 Profesjonalna wskazówka:
Używaj HMA lub ZLEMA dla złota lub rynków o dużej zmienności. Używaj SMA/EMA dla Forex i indeksów dla płynniejszych sygnałów. Dostosuj poziomy górne/dolne w zależności od zmienności (np. ±2–3 dla Forex, ±5–10 dla złota).