
ICT First Presented FVG
Wskaźnik
188 pobrania
Wersja 1.1, Apr 2026
Windows, Mac

Opis
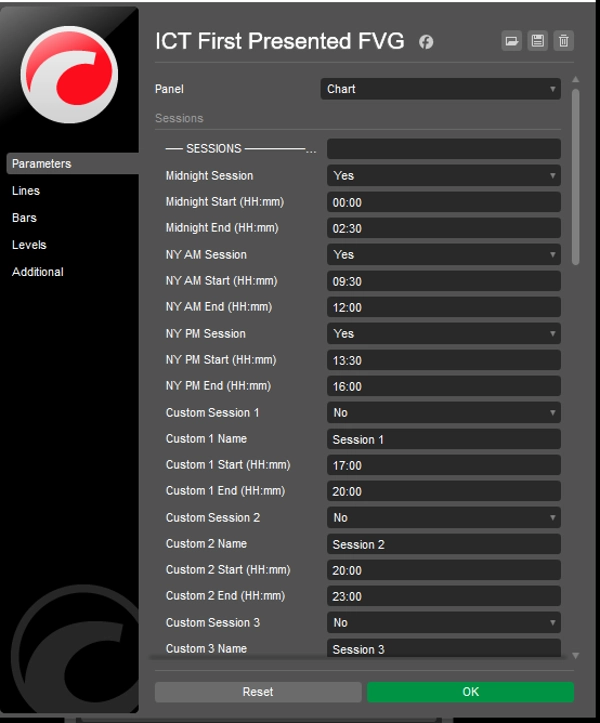
To jest specjalistyczny wskaźnik oparty na ICT, który koncentruje się na jednym "punkcie kotwicznym": otwarciu giełdy nowojorskiej o 9:30.
Oto bezpośrednie podsumowanie:
🎯 Główna funkcja
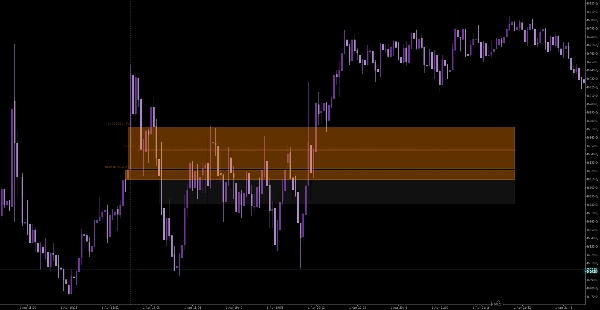
Wskaźnik ignoruje całą akcję cenową aż do otwarcia o 9:30. Gdy rynek się otwiera, poszukuje pierwszej w ogóle Luka Wartości Rynkowej (FVG), która się pojawia. W teorii ICT ta pierwsza luka często jest "śladem instytucjonalnym" dla kierunku sesji porannej.
🛠️ Kluczowe cechy
- Automatyczne wyszukiwanie: Nie musisz samodzielnie przeszukiwać wykresu 1-minutowego lub 5-minutowego; wskaźnik natychmiast podświetla pierwszą ważną nierównowagę po sygnale otwarcia.
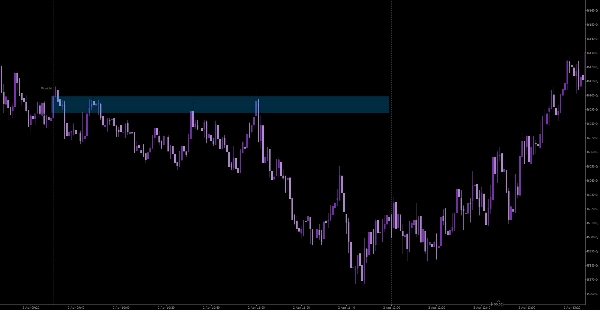
- Rozszerzone pola: Rysuje pole, które jest przedłużone do aktualnej ceny. Pozwala to zobaczyć, czy cena później w ciągu dnia "testuje" lub "wypełnia" tę konkretną poranną lukę.
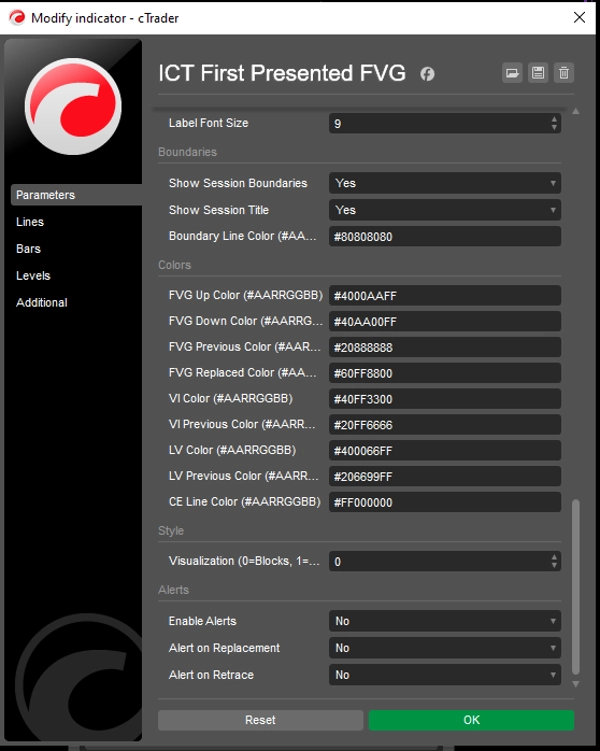
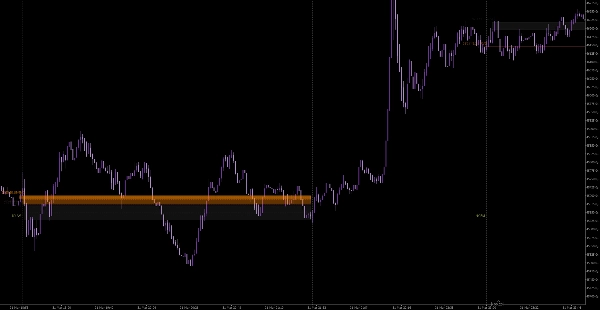
- Kontrola wizualna: Możesz przełączać się między pełnymi blokami a prostymi liniami oraz zmieniać kolory, aby dopasować je do swojego szablonu wykresu.
- Śledzenie wzorców: Dodaje etykiety dat, dzięki czemu możesz spojrzeć wstecz na poprzednie dni, aby zobaczyć, jak często FVG o 9:30 utrzymywała się jako wsparcie lub opór.
💡 Jak możesz robić to lepiej
Chociaż to narzędzie jest świetne do znajdowania "ustawienia", nie daje ci "kontekstu". Aby poprawić swoją skuteczność z tym wskaźnikiem:
- Bias na wyższym interwale czasowym: Podejmuj pozycje "Long" na FVG o 9:30 tylko wtedy, gdy twój trend na wykresie 1-godzinnym lub 4-godzinnym jest już byczy. Jeśli podejmujesz każdą "pierwszą FVG" bezmyślnie, zostaniesz posiekany.
- Czekaj na "huśtawkę Judasza": Często pierwsza FVG o 9:30 to pułapka (fałszywy ruch). Jeśli pierwsza FVG zawiedzie, a cena utworzy drugą w przeciwnym kierunku, to zwykle jest to prawdziwy ruch dnia.
- Zasada "wypełnienia": Jeśli cena wróci i całkowicie zamknie FVG o 9:30, jej instytucjonalna "siła" znika. Szukaj tylko transakcji, gdzie cena dotyka krawędzi pola i od niej się odbija.
Podsumowanie
Podsumowanie AI
ICT First Presented FVG is a specialized trading indicator based on Inner Circle Trader (ICT) theory, designed to identify the first Fair Value Gap (FVG) that forms immediately after the 9:30 AM New York Stock Exchange open. This initial gap is considered a key institutional footprint indicating the morning session’s directional bias.
Key features include automated detection of the first valid imbalance after the market opens, eliminating the need for manual scanning of short-term charts. The indicator visually highlights this gap with an extended box projecting forward to the current price, allowing traders to monitor if and when the gap is retested or filled during the day. Users can customize the visual style with solid blocks or lines and adjust colors to match their chart templates. Additionally, date labels track past occurrences to analyze how often the 9:30 AM FVG acts as support or resistance.
The indicator supports markets including Forex, indices, commodities, stocks, and cryptocurrencies such as BTCUSD and EURUSD. It is intended to be used alongside higher timeframe trend analysis and price action context to improve trade decision-making, particularly by observing patterns like the "Judas Swing" and the behavior of price around the FVG fill level.
Profil wskaźnika
Opinie klientów
0.0
Opinie: 0
Opinie klientów
Ten produkt nie ma jeszcze opinii. Wypróbowałeś(-aś) go już? Bądź pierwszy(-a) i powiedz o tym innym!
Dyskusja
Częste pytania
BTCUSD
Forex
Signal
Breakout
Indices
EURUSD
Commodities
GBPUSD
NZDUSD
Martingale
Prop
Scalping
SMC
Crypto
Grid
Stocks
AI
XAUUSD
NAS100
USDJPY
Produkty dostępne za pośrednictwem cTrader Store, w tym boty handlowe, wskaźniki i wtyczki, dostarczane są przez deweloperów zewnętrznych i udostępniane wyłącznie w celach informacyjnych oraz w celu zapewnienia dostępu technicznego. cTrader Store nie jest brokerem i nie zapewnia doradztwa inwestycyjnego, nie udziela spersonalizowanych rekomendacji ani nie gwarantuje przyszłych wyników.
Więcej od tego autora


Cena
2.85K
Bezpłatne instalacje