
Htfbiaspanel
Wskaźnik
Wersja 1.0, Apr 2026
Windows, Mac
4.7
Opinie: 4
Trading product for Htfbiaspanel Wskaźnik BTCUSD Forex, image 2
Trading product for Htfbiaspanel Wskaźnik BTCUSD Forex, image 3
Trading product for Htfbiaspanel Wskaźnik BTCUSD Forex, image 4

Opis

━━━━━━━━━━━━━━━━━━━━━━━━━━━━━━━━━━━━━━━━

Panel Bias HTF — Bias

━━━━━━━━━━━━━━━━━━━━━━━━━━━━━━━━━━━━━━━━


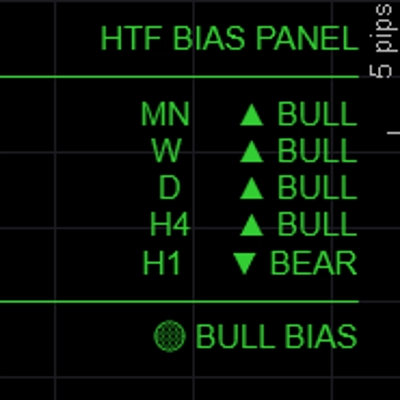
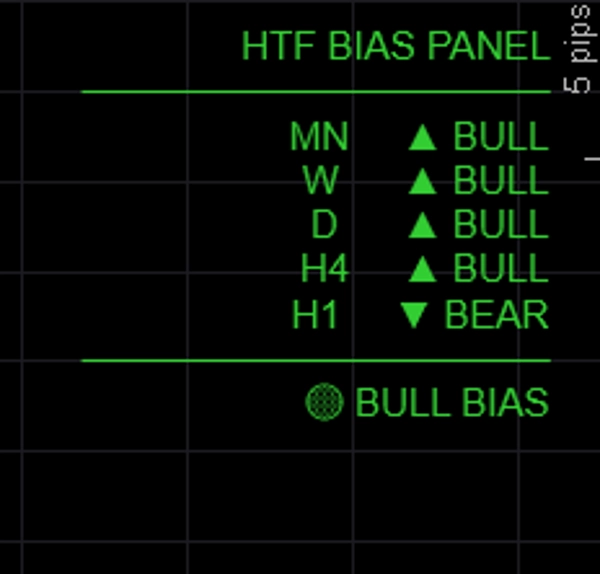
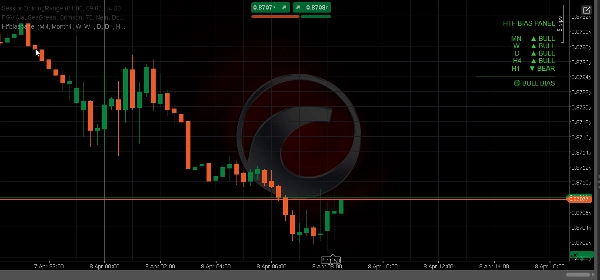
Pokazuje kierunkowe nastawienie dla maksymalnie pięciu ram czasowych jednocześnie w czystym panelu na wykresie — dzięki czemu zawsze wiesz, czy wyższe ramy czasowe są bycze, niedźwiedzie czy mieszane przed wejściem w transakcję.


─────────────────────────────

KLUCZOWE CECHY


► 5 w pełni konfigurowalnych ram czasowych — domyślnie MN / W / D / H4 / H1, wszystkie etykiety i TF można dostosować

► Trzy metody bias — wybierz, jak bias jest określany dla każdej sesji:

• EMA: zamknięcie powyżej/poniżej EMA(50) → najbardziej niezawodne dla podążania za trendem

• Cena vs ostatnie zamknięcie: bieżące zamknięcie vs poprzednie zamknięcie → reaktywne, oparte na momentum

• BOS: ostatni zakres vs poprzedni zakres → bias oparty na strukturze

► Podsumowanie zgodności — PEŁNY BYCZY / PEŁNY NIEDŹWIEDZI / BYCZY BIAS / NIEDŹWIEDZI BIAS / NEUTRALNY wyświetlane na dole panelu

► Wyjście kodowane kolorami — zielony dla byczego, czerwony dla niedźwiedziego, szary dla neutralnego

► Pozycja panelu — umieść w lewym górnym, prawym górnym, środkowym górnym, lewym dolnym lub prawym dolnym rogu

► W pełni konfigurowalne kolory dla stanów byczego, niedźwiedziego i neutralnego

► Lekki — bez rysunków na wykresie, bez prostokątów, bez obciążenia


─────────────────────────────

WYJAŚNIENIE METOD BIAS


→ EMA (domyślnie): Byczy, jeśli zamknięcie > EMA(okres). Najbardziej stabilna, ignoruje krótkoterminowy szum.

→ Cena vs ostatnie zamknięcie: Byczy, jeśli zamknięcie bieżącej świecy > zamknięcie poprzedniej świecy. Szybka i reaktywna.

→ BOS: Porównuje ostatni zakres N świec do poprzedniego zakresu N świec. Byczy, jeśli wyższe szczyty i wyższe dołki.


─────────────────────────────

USTAWIENIA DOMYŚLNE


→ TF1 Miesięczny (MN)

→ TF2 Tygodniowy (W)

→ TF3 Dzienny (D)

→ TF4 H4

→ TF5 H1 (możliwość włączania/wyłączania)

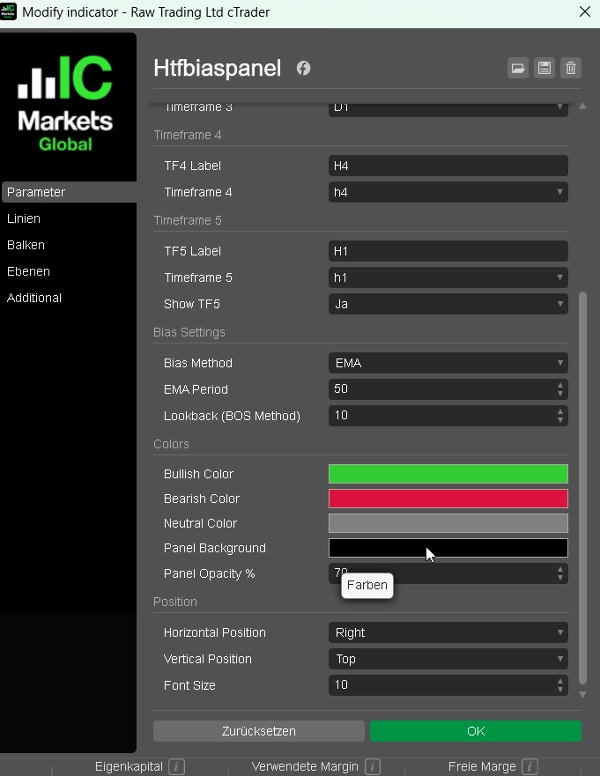
→ Metoda bias EMA

→ Okres EMA 50

→ Kolor byczy LimeGreen

→ Kolor niedźwiedzi Crimson

→ Pozycja Lewy Górny


─────────────────────────────

JAK UŻYWAĆ


1. Dodaj panel do dowolnego wykresu

2. Wybierz preferowaną metodę bias (EMA zalecane dla początkujących)

3. Sprawdź podsumowanie zgodności przed wejściem w transakcję — bierz tylko pozycje długie, gdy BULL BIAS lub PEŁNY BYCZY

4. Używaj bias HTF do filtrowania sygnałów z twojego wskaźnika BOS/CHoCH lub FVG — handluj tylko w kierunku potwierdzonym przez panel

5. Dostosuj ramy czasowe do swojego stylu handlu (np. D / H4 / H1 / M15 / M5 dla skalperów)


─────────────────────────────

IDEALNE DLA


✔ Traderów ICT i Smart Money Concepts potrzebujących szybkiej analizy top-down

✔ Traderów multi-timeframe, którzy chcą szybkiego wizualnego sprawdzenia bias

✔ Traderów FTMO i firm prop, którzy muszą handlować z konfluencją

✔ Każdego tradera, który chce unikać handlu przeciwko trendowi wyższej ramy czasowej

✔ Traderów Forex, Złota, Indeksów i Crypto CFD


─────────────────────────────

KOMPATYBILNOŚĆ


→ Platforma cTrader (Desktop & Web)

→ Klasy aktywów Forex, Indeksy, Surowce, Crypto CFD

→ Ramy czasowe Wszystkie (M1 do MN)

→ Prawa dostępu Brak wymagań

→ Typ konta Live & Demo


━━━━━━━━━━━━━━━━━━━━━━━━━━━━━━━━━━━━━━━━


Podsumowanie

Podsumowanie AI
HTF Bias Panel is a trading indicator designed for the cTrader platform (desktop and web) that displays directional market bias across up to five configurable timeframes simultaneously. It provides a clear on-chart panel showing whether higher timeframes are bullish, bearish, or neutral, aiding traders in aligning their entries with the prevailing trend. Users can select from three bias determination methods: EMA (close relative to EMA 50), Price vs Last Close (momentum-based), and BOS (structure-based range comparison). The panel includes an alignment summary indicating overall market bias states such as FULL BULL or FULL BEAR, with color-coded signals (green for bullish, red for bearish, gray for neutral). The panel’s position and colors are fully customizable. Default timeframes range from monthly to hourly but can be adjusted to suit different trading styles, including scalping. The indicator is lightweight, with no chart drawings or overhead. It supports multiple asset classes including Forex, Indices, Commodities, and Crypto CFDs. HTF Bias Panel is suitable for traders using Smart Money Concepts, multi-timeframe analysis, or those requiring confluence with prop firm trading rules. It helps avoid trading against higher timeframe trends by providing a fast visual bias check.
Profil wskaźnika
Kategoria wskaźnika
Struktura rynku (SMC)
Typ wyjścia
Wizualizacja
Filtr
Wymagania dotyczące danych
Tylko słupki
Wolumen
Obsługiwane sygnały
Zakres otwarcia sesji
Przełamanie
Siła trendu
Odwrócenie trendu

Opinie klientów

4.7
Opinie: 4
5
75 %
4
25 %
3
0 %
2
0 %
1
0 %
Opinie klientów
April 23, 2026
pretty solid as a second look, especially in busy review sessions.
April 21, 2026
it earns a spot because it supports the idea without replacing judgment, and a 5 minute check should not become a 30 minute rabbit hole.
April 19, 2026
HTF Bias Panel is a clean and highly practical tool for multi-timeframe analysis. It quickly shows directional bias across up to five timeframes, helping traders stay aligned with the bigger picture. With multiple bias methods and a clear alignment summary, it’s an excellent filter to avoid trading against higher timeframe trends. Simple, fast, and very effective.
April 19, 2026
5 to 8 markets is a fair first sample, and the setup review feels more organized.

Dyskusja

Częste pytania

BTCUSD
Forex
Indices
EURUSD
Commodities
GBPUSD
NZDUSD
Prop
Fair Value Gap
SMC
Crypto
XAUUSD
NAS100
USDJPY
Produkty dostępne za pośrednictwem cTrader Store, w tym boty handlowe, wskaźniki i wtyczki, dostarczane są przez deweloperów zewnętrznych i udostępniane wyłącznie w celach informacyjnych oraz w celu zapewnienia dostępu technicznego. cTrader Store nie jest brokerem i nie zapewnia doradztwa inwestycyjnego, nie udziela spersonalizowanych rekomendacji ani nie gwarantuje przyszłych wyników.

Więcej od tego autora

Wskaźnik
SMC
Prop
+6
Automatically draws the Opening Range (High & Low) for Tokyo, London, and New York sessions. Configurable start times,
Wskaźnik
Liquidity Grab
Liquidity Sweep
+2
Visualizes accumulation ranges, manipulation sweeps and distribution phases on your cTrader chart.
Wskaźnik
BOS
Key Levels
+2
Maps bullish and bearish order block zones, CE levels and structure-based price action context.
Wskaźnik
Key Levels
Liquidity Grab
+3
Visual market context dashboard showing bias states, CE positioning, session status and sweep context.
Wskaźnik
SMC
Prop
+12
Killzone, ICT, SMC, Session, Asia, London, New York, NY PM, Session High, Session Low, Smart Money, Order Flow, Trading
Wskaźnik
MSS
Key Levels
+2
Maps equal highs, equal lows and active liquidity pools directly on your cTrader chart.
Wskaźnik
EMA
RSI
+2
Compact premium cTrader dashboard for market bias, sessions, premium/discount context, liquidity direction, ADR range an
Wskaźnik
BOS
MSS
+3
Maps BOS, CHoCH, swing breaks and market structure shifts directly on your cTrader chart.
Wskaźnik
MSS
Key Levels
+4
Maps session ranges, previous highs/lows, equilibrium and premium/discount zones on your cTrader chart.

Możesz także polubić

Wskaźnik
IVB 2.0 is an indicator that works on the strategy of imbalance of the maximum volatility box of indices
Wskaźnik
Color-Based Market Pressure & Volatility Visualizer The Kandika Heatmap Indicator
Wskaźnik
MSS
Key Levels
+4
Maps session ranges, previous highs/lows, equilibrium and premium/discount zones on your cTrader chart.
Wskaźnik
AI
ATR
+27
An advanced VWAP with multi-VWAP (Daily/Weekly/Monthly/Anchored), click-to-anchor, configurable alerts, a stats panel,
Wskaźnik
Signal
Breakout
+1
Bolliger Bands + Hamster-Coder™ Timeframe Decoupling
Wskaźnik
Grid
Prop
+14
Visualize trends with Standard Deviation Channel! Display median, and add customizable upper/lower deviation channels.
Wskaźnik
ADX
ATR
+5
10 Factors. One Signal. Zero Guesswork.
Wskaźnik
BOS
MSS
+3
Orderblocks with Multi-Timeframe.
Wskaźnik
Forex
BTCUSD
+12
🎯Automatically identifies the market's significant turning points (key H & L) and draws dynamic support and.....✍️
Wskaźnik
EMA
RSI
+5
MACD Colour Histogram with 11 Moving Average Types, Multi-timeframe confirmation and Sound Signal Alert.
Wskaźnik
BOS
MSS
+3
Maps BOS, CHoCH, swing breaks and market structure shifts directly on your cTrader chart.
Wskaźnik
ATR
Engulfing
+5
This indicator maps D1, H4, H1 and 15M Multi-Timeframe Bias and Fresh High Probability Supply and Demand zones
Wskaźnik
Prop
Scalping
Shows bars from different Time Frame on zoom out and hides the current bars. Perfect tool for Multi TF "Market Reply"
Wskaźnik
Forex
NZDUSD
+2
RCS: 8 majors! AUD,USD,EUR,JPY,GBP,CAD,CHF,NZD. Find how strong each currency is relatively and trade smarter!
Wskaźnik
Drawdown Monitor
Proprietary trading desk risk monitoring dashboard!
Wskaźnik
BOS
MSS
+3
Advanced indicator to highlight key execution context and help aligning structure, location, and risk.
Wskaźnik
ATR
Forex
+5
Most used candle patterns. (1 candle, 2 candles and 3 candles patterns) and Marubozu. Bonus Fibo Risk control.
Wskaźnik
ATR
RSI
+24
Daily moving averages, simplified. Displays 3 daily moving averages on lower timeframes with selectable MA types.

Cena


























