


Descripción
Qué hace
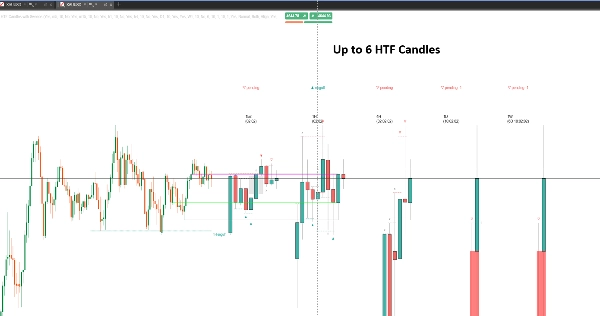
HTF Candles with Sweeps dibuja hasta seis marcos temporales superiores como velas reales junto a tu gráfico — 5m, 15m, 1H, 4H, Diario, Semanal, o cualquier resolución que elijas — para que la historia del marco temporal superior esté al lado del precio que estás operando en lugar de a un cambio de gráfico de distancia.
Encima de esas velas detecta barridos de liquidez: una vela que negocia a través de un máximo o mínimo detrás de ella para tomar las órdenes que descansan allí. La mayoría de las herramientas se detienen en señalar el toque. Esta sigue lo que sucede después, porque un barrido que se recupera y un barrido que se convierte en una ruptura significan cosas opuestas.
El panel de marcos temporales superiores
Seis ranuras independientes, cada una con su propio marco temporal, conteo de velas y colores. Cada conjunto dibuja con cuerpos y mechas adecuados, una cuenta regresiva en vivo para el próximo cierre y etiquetas de marco temporal arriba y abajo.
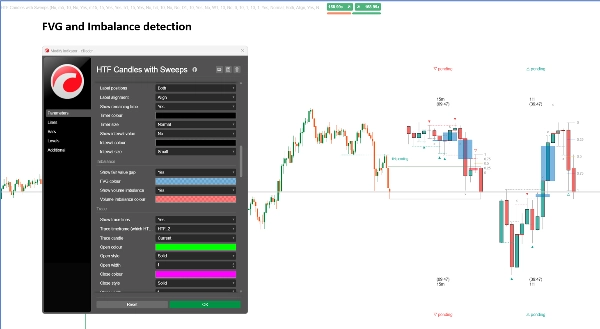
Entre las velas dibujadas, el panel también marca brechas de valor justo y desequilibrios de volumen — los mismos desequilibrios que leerías en el gráfico de marco temporal superior, sin abrirlo.
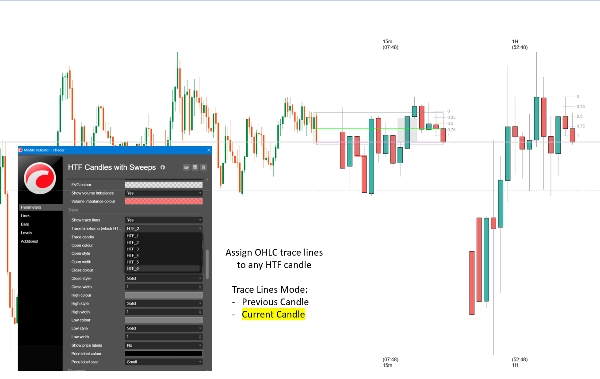
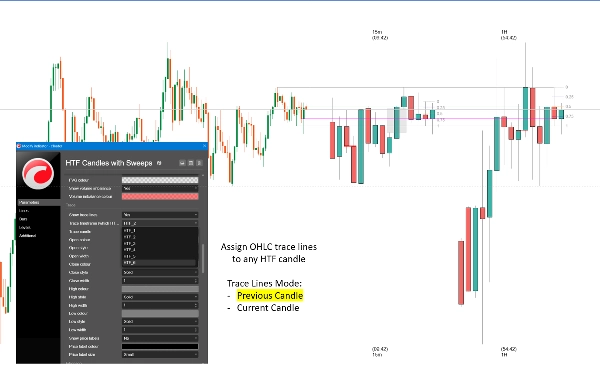
Líneas de trazo conectan la apertura, máximo, mínimo y cierre de un marco temporal elegido con la barra exacta en tu gráfico donde cada uno se imprimió, para que puedas ver de dónde vino un nivel. Elige la vela aún en formación o la última completada.
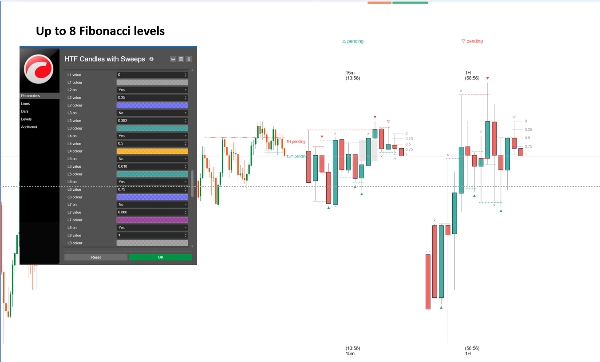
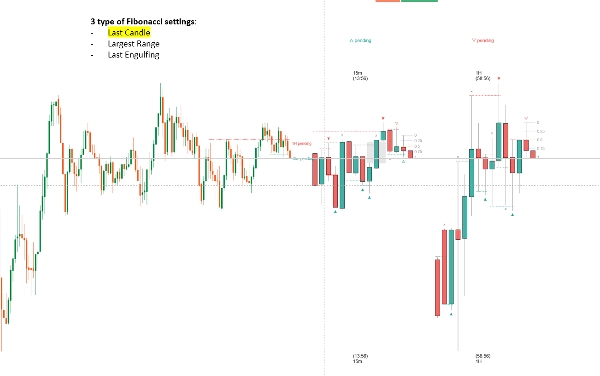
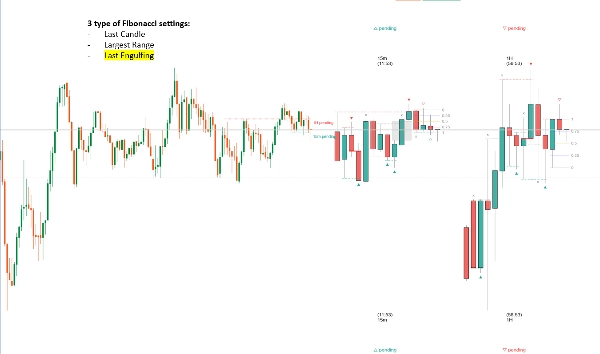
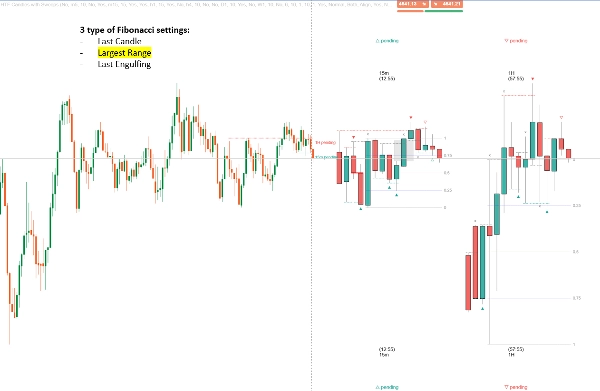
Niveles de Fibonacci se proyectan desde una vela de marco temporal superior con ocho niveles configurables y un Ancla Inteligente que elige la vela por ti: la última barra completada, la vela de máximo a mínimo más amplia en vista, o la vela envolvente más reciente.
Detección de barridos de liquidez
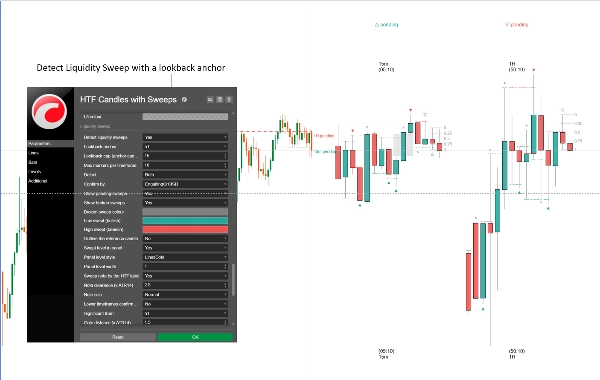
Para cada vela completada de marco temporal superior, el motor retrocede y encuentra el máximo más alto — o mínimo más bajo — que la vela realmente superó, deteniéndose en la primera vela que no pudo superar. Ese nivel es lo que el barrido tomó.
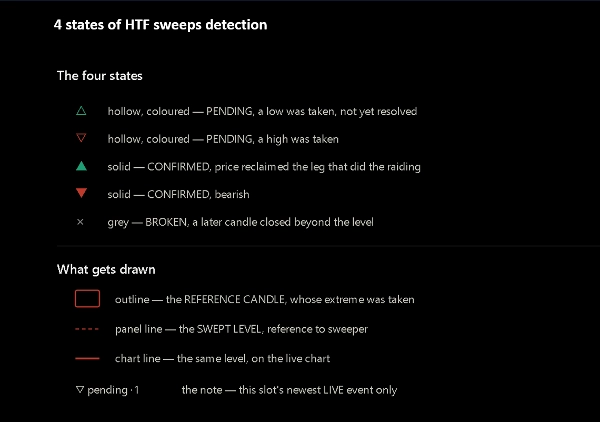
El barrido luego se sigue a través de cuatro estados:
— Pendiente — el nivel fue tomado, nada lo ha resuelto aún
— Confirmado por CISD — el precio cerró de nuevo a través de la apertura de la corrida que produjo el extremo
— Confirmado por envolvente — el cuerpo de una vela posterior engulló la vela barrida y cerró en contra de ella
— Roto — una vela posterior cerró más allá del nivel, por lo que fue una ruptura, no un barrido
Cada estado lleva su propio marcador, así que una vela que barrió algo siempre lo muestra, y el marcador te dice cómo terminó. Nada se repinta: solo se juzgan velas completadas, y cada cambio de estado se decide en un cierre.
Confluencia entre marcos temporales
Una ventana de retroceso se expresa en velas de un marco temporal ancla y se convierte en el conteo de velas propio de cada ranura, por lo que un barrido de 15m y un barrido horario se miden a través del mismo lapso de mercado. Cuando varios marcos temporales coinciden, realmente están describiendo el mismo evento.
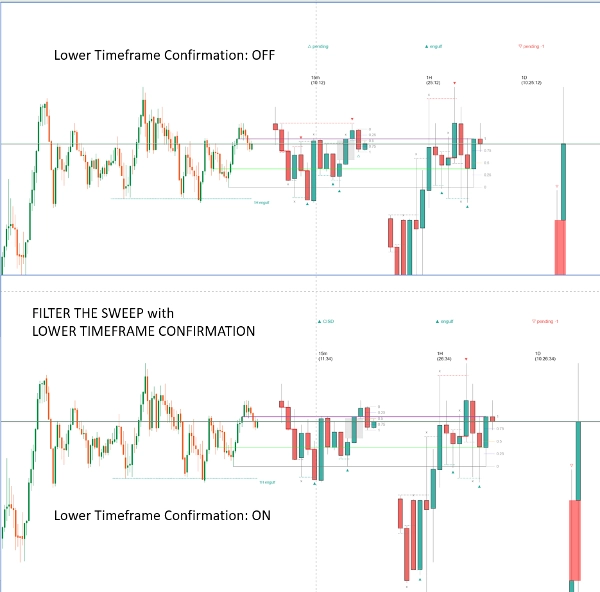
Una puerta opcional lleva esto más lejos: los marcos temporales por debajo de una división que elijas solo reportarán un barrido cuando un marco temporal por encima de ellos ya tenga uno activo, en la misma dirección, a un precio comparable. Los marcos temporales inferiores dejan de reportar ruido de rango y comienzan a confirmar el movimiento mayor.
Niveles barridos en tu gráfico
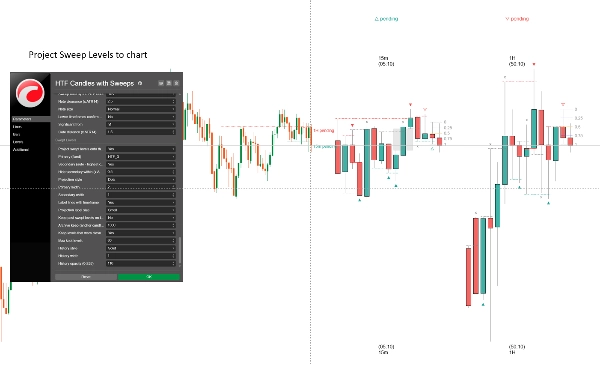
El panel muestra las velas; el gráfico muestra el precio. Un nivel barrido se dibuja como una línea horizontal que corre desde donde la vela de referencia realmente se formó, hacia adelante hasta ahora — etiquetada con su marco temporal y estado actual. Una línea primaria proviene de un marco temporal que fijas; una línea secundaria se llena automáticamente con el marco temporal más alto actualmente barrido.
Un archivo opcional mantiene los niveles barridos pasados en el gráfico después de que su vela haya salido del panel, para que puedas revisar cómo se comportó la detección durante la sesión.
Uso típico
Opera desde un gráfico de 5m o 15m mientras las velas horarias y de 4 horas están al lado. Cuando un marco temporal superior barre un nivel y lo confirma, tienes una dirección y un precio desde donde trabajar. Cuando el marco temporal inferior está de acuerdo, tienes confluencia. Cuando un nivel se rompe en cambio, el marcador también te lo dice, y dejas de esperar una reversión que no llegará.
Es adecuado para trading de barridos de liquidez y estilo dinero inteligente, trabajo de rupturas fallidas y cualquier enfoque basado en máximos y mínimos previos. Útil en forex, índices, metales y criptomonedas.
Configuraciones
— Seis ranuras de marco temporal, cada una con resolución, conteo de velas, conmutador de fibonacci y estilo completo
— Diseño del panel: relleno desde el precio, ancho de vela, espacio entre velas y entre marcos temporales
— Etiquetas: nombre del marco temporal arriba y abajo, temporizador de cuenta regresiva, valores de intervalo, tamaños y colores
— Desequilibrio: brechas de valor justo y desequilibrios de volumen, colores ajustables
— Líneas de trazo: qué ranura, vela actual o anterior, color por línea, estilo, ancho y etiquetas de precio
— Fibonacci: ocho niveles con valores individuales, colores y conmutadores, más tres modos de Ancla Inteligente
— Detección de barridos: ancla y límite de retroceso, dirección, ruta de confirmación, límite de marcadores por marco temporal
— Apariencia del marcador para estados pendiente, confirmado y roto
— Puerta de confluencia: división de marco temporal y tolerancia de distancia
— Proyección en gráfico: ranura primaria, secundaria automática, estilos y etiquetas
— Archivo: retención en velas ancla, máximo guardado, estilo
Para quién es
Traders intradía y swing que ya trabajan con máximos y mínimos de marcos temporales superiores y quieren que sean visibles sin cambiar de gráfico. Asume que sabes qué es un barrido de liquidez y por qué importa una recuperación. Si los barridos no son ya parte de cómo lees un gráfico, esto no te enseñará a operarlos.
Qué no hace
Ser claro sobre esto ahora nos ahorra tiempo a ambos después:
— No da señales de compra o venta, ni precios de entrada, stop o objetivo
— No coloca órdenes y no puede tocar tu cuenta — el indicador funciona sin derechos de acceso
— No tiene alertas ni notificaciones
— No predice nada. Cada marcador describe velas que ya cerraron
— No se repinta. Solo se juzgan velas completadas, por lo que un marcador nunca cambia después del hecho
— No es una estrategia. Un barrido confirmado describe lo que hizo el precio, no lo que deberías hacer al respecto
Cosas que vale la pena saber
La detección lee las velas que cada ranura realmente dibuja, por lo que un barrido siempre tiene una vela en pantalla para marcar.
Aumentar el conteo de velas de una ranura amplía cuánto puede mirar hacia atrás.
Las velas de marcos temporales superiores comienzan en la hora del servidor de tu bróker. Dos brókers en el mismo instrumento pueden cortar la hora o el día en puntos diferentes, lo que significa que el mismo símbolo puede leerse legítimamente de manera diferente en dos plataformas. Eso es una propiedad de los datos, no un fallo del indicador.
Un barrido en la vela más recientemente cerrada solo puede estar pendiente — la confirmación necesita que una vela posterior cierre. En la ranura diaria eso significa esperar un día.
El trading implica riesgo. El rendimiento pasado no garantiza resultados futuros.
Resumen
The indicator detects liquidity sweeps—candles that trade through previous highs or lows to capture resting orders—and tracks their resolution through four states: pending, confirmed by close inside the sweep’s range, confirmed by engulfing candle, or broken (breakout). These states are visually marked and only finalized on completed candles, ensuring no repainting.
Additional features include marking fair value gaps and volume imbalances between candles, trace lines linking higher timeframe candle levels to your chart, and configurable Fibonacci levels projected from selected higher timeframe candles with smart anchoring options.
Cross-timeframe confluence is supported by aligning sweep detection across multiple timeframes, with an optional gate to filter lower timeframe sweeps that confirm higher timeframe moves. Swept levels are drawn as horizontal lines on your chart with labels indicating timeframe and state, with an optional archive to retain past levels.
Designed for intraday and swing traders familiar with liquidity sweeps and higher timeframe analysis, it supports markets including forex, indices, metals, and crypto. The indicator does not provide trade signals, alerts, or order execution and operates solely as a visual analysis tool based on completed price data.
Conversación
Valoraciones de clientes
Preguntas frecuentes
Más de este autor





![Logotipo de "[Stellar Strategies] VBO"](https://cdn.ctrader.com/image/webp/f034c012-94d4-445a-a01b-febd1cdedaef_36944)










![Logotipo de "[Stellar Strategies] Market Session Ultimate"](https://cdn.ctrader.com/image/webp/61ffd537-0125-4246-9e72-42eca1791d64_28232)



Precio