present
Zarejestruj się i otrzymaj 50 $ zniżki na pierwszy zakup
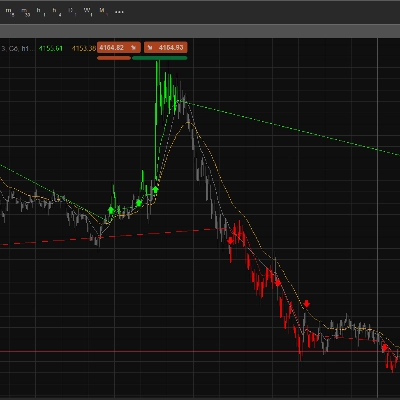
Trading product for Dynamic swing levels reader Wskaźnik Fibonacci Fair Value Gap, image 1
Dynamic swing levels reader
Wskaźnik
1 pobrania
Wersja 1.1, Nov 2026
Windows, Mac
Trading product for Dynamic swing levels reader Wskaźnik Fibonacci Fair Value Gap, image 2
1
Bezpłatne instalacje

Opis

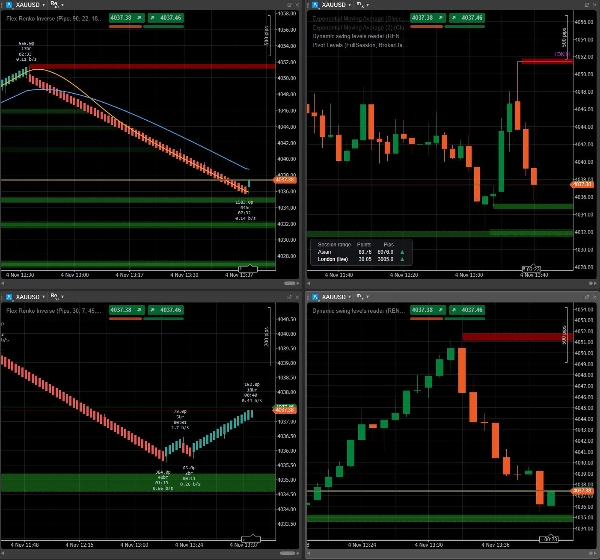
Dynamic Swing Levels Reader - the companion to Flex Renko Inverse

Flex Renko charts are excellent for spotting where the market really turned. Most traders, though, still execute on regular timeframe charts: M1, M5, H1. Dynamic Swing Levels Reader connects the two. It takes the swing zones from a Flex Renko Inverse chart and draws them, live, on any timeframe chart of the same symbol.


What "Requires Flex Renko Inverse" means

This indicator does not calculate anything by itself. It is a reader. The zones are created by Flex Renko Inverse, our main study, which builds renko bricks tick by tick and marks every confirmed reversal as a swing zone. Zones that price has not yet come back to are shared, and the Reader displays exactly those.

Without Flex Renko Inverse running on one of your charts, the Reader has nothing to show. That is why it is free: it extends the main study, it does not replace it.


How it works

  1. Open a Flex Renko Inverse chart and give it a name in "Instance name" (for example RENKO_CONTEXT)
  2. On any timeframe chart of the same symbol, add Dynamic Swing Levels Reader and type the same name in "Read swing levels from"
  3. That's it. The zones appear and stay in sync. When price reaches a zone it disappears from both charts, and new zones show up as soon as the renko chart creates them

Both charts must be open in cTrader on the same computer. If something is not connected (wrong name, different symbol, renko chart closed), the indicator tells you on the chart what is missing.


Why get Flex Renko Inverse

The swing zones are just one of its features. Flex Renko Inverse gives you:

  • Renko bricks built from real ticks, never from aggregated bars, with separate settings for trend continuation and reversal. Closed bricks never repaint
  • Swing zones with strength: the bigger the move that started from a turning point, the more visible its zone
  • Leg labels with the size, number of bricks, duration and speed of every swing, plus an arrow when the current leg is moving faster than usual
  • A rotation dashboard that shows, across 1, 5, 15 and 30 minutes, whether swings are getting wider or narrower and which side is in control
  • Moving averages calculated on bricks, not on hidden candles
  • The real time of every brick under your cursor

Use a slower renko as your context, share its zones, and trade them on the timeframe you are used to.


👉 Get Flex Renko Inverse: https://ctrader.com/products/5546

Podsumowanie

Podsumowanie AI
Dynamic Swing Levels Reader is an indicator designed to display swing level zones generated by the Flex Renko Inverse study on any timeframe chart within cTrader. It functions as a companion tool that reads and visualizes swing zones created by Flex Renko Inverse, which builds Renko bricks tick-by-tick and identifies confirmed reversals as swing zones. These zones are shared live and synchronized between the Flex Renko Inverse chart and any other chart of the same symbol, allowing traders to view Renko-based swing levels on their preferred timeframe charts (e.g., M1, M5, H1).

To use it, a Flex Renko Inverse chart must be open and named; the Dynamic Swing Levels Reader then references this name to display the corresponding swing zones. Zones disappear once price revisits them, and new zones appear as the Renko chart updates. Both charts must be open simultaneously on the same computer.

Flex Renko Inverse offers advanced features including real-tick Renko bricks with separate trend and reversal settings, swing zones weighted by move strength, detailed leg metrics (size, duration, speed), a multi-timeframe rotation dashboard, and moving averages calculated on bricks. This setup enables traders to use slower Renko charts for market context while executing trades on their usual timeframe charts.

Profil wskaźnika
Kategoria wskaźnika
Wsparcie i opór
Typ wyjścia
Wizualizacja
Wymagania dotyczące danych
Tylko słupki
Dane zewnętrzne
Obsługiwane sygnały
Przecięcie
Dywergencja
Przełamanie
Odwrócenie trendu
Siła trendu
Zmienność
Dotknięcie poziomu
Przebicie poziomu

Dyskusja

Opinie klientów

0.0
Opinie: 0
Opinie klientów
Ten produkt nie ma jeszcze opinii. Wypróbowałeś(-aś) go już? Bądź pierwszy(-a) i powiedz o tym innym!

Częste pytania

Fibonacci
Fair Value Gap
Key Levels
Order Block
Market Structure
Supply & Demand
Support & Resistance
Produkty dostępne za pośrednictwem cTrader Store, w tym boty handlowe, wskaźniki i wtyczki, dostarczane są przez deweloperów zewnętrznych i udostępniane wyłącznie w celach informacyjnych oraz w celu zapewnienia dostępu technicznego. cTrader Store nie jest brokerem i nie zapewnia doradztwa inwestycyjnego, nie udziela spersonalizowanych rekomendacji ani nie gwarantuje przyszłych wyników.

Więcej od tego autora

Logo „Flex Renko Inverse”
Najwyżej oceniane
4.2
(4)
$99
Wskaźnik
Pin Bar
Order Block
+5
NEVER MISS A TREND & LET TRENDS RUN with Sierra Chart's Flex Renko Inverse, rebuilt for cTrader.
Wskaźnik
Fibonacci
Key Levels
+5
Draws RTH, Asian, London, prior day/week, ORB, Floor and Camarilla pivot levels as rays, with a session range table.

Możesz także polubić

Wskaźnik
Prop
Forex
+13
A real-time tick imbalance analysis tool designed specifically for Tick Imbalance Bars Plugin*
Wskaźnik
VWAP
Support & Resistance
Trading.FC$_vwap Algo shows VWAP trends, dynamic support/resistance and deviation bands to spot potential trade entries.
Wskaźnik
AI
ATR
+26
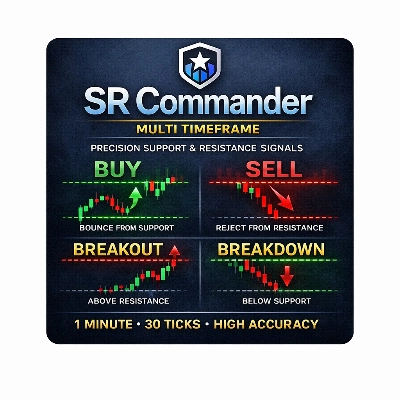
SR Commander — Multi Timeframe Edition. See where the big money draws the line. Trade on your timeframe. Think on theirs
Wskaźnik
ATR
Forex
+1
Trade fearlessly: auto-adjusts order blocks, manages risks, and ensures precision. Free for early users.
Wskaźnik
Forex
NZDUSD
+2
RCS: 8 majors! AUD,USD,EUR,JPY,GBP,CAD,CHF,NZD. Find how strong each currency is relatively and trade smarter!
Wskaźnik
ADX
ATR
+5
Configure, simulate, and analyze trading strategies with custom filters, multi-target exits, and detailed performance me
Wskaźnik
Pin Bar
Inducement
+5
Institutional Nasdaq Session Liquidity Map with Live Point HUD, Sweep Alerts & Interactive Playbook.
Wskaźnik
Forex
BTCUSD
+10
(ViPi) MTF Candle displays multiple higher timeframe candles right on your current chart for ultimate trend analysis.
Wskaźnik
Volume
Key Levels
View tick activity across a selected chart range with Point of Control, Value Area High and Value Area Low.
Wskaźnik
ATR
MSS
+5
Advanced market structure and institutional cycle mapper with visual reference cards and entry alerts
Wskaźnik
Prop
Forex
+5
Traders Panel: Scan 15 pairs across 5 timeframes. Live heatmap, strength rankings and best setups in one panel.
Wskaźnik
Forex
BTCUSD
+5
Multi-timeframe moving averages with session lines for structured trend analysis directly on the chart.
Wskaźnik
Prop
Forex
+4
Price Action Zone shows previous D/W/M key levels to help frame intraday price action, liquidity, and market structure.
Wskaźnik
ADX
ATR
+2
GOLD SENTINEL v1.0 - A CANDLE-COLORING INDICATOR FOR GOLD.
Wskaźnik
ATR
BOS
+3
Fair Value Gaps with Multi-Timeframe.
Wskaźnik
Prop
Forex
+11
😎Read the description before purchasing💩
Wskaźnik
Forex
Crypto
+5
🚀 Automated Elliott Wave & Fibonacci tool for cTrader. Spot trends, corrections & retracements fast.
Wskaźnik
SMC
Forex
+4
Identifies institutional zones with Volume Delta (K) across any asset or chart for high-precision entry detection.

Cena

1
Bezpłatne instalacje