Opis
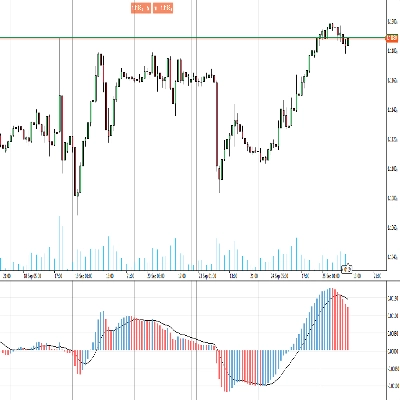
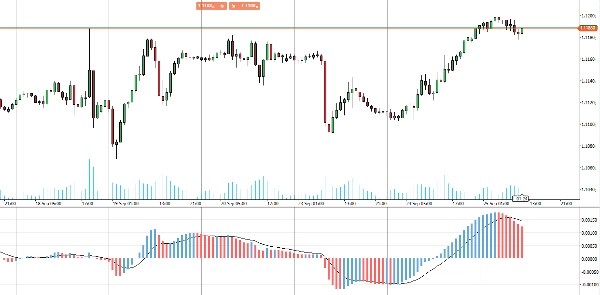
Przedstawiamy ulepszony Histogram MACD, zaprojektowany, aby zapewnić jaśniejsze i bardziej wnikliwe doświadczenie handlowe.
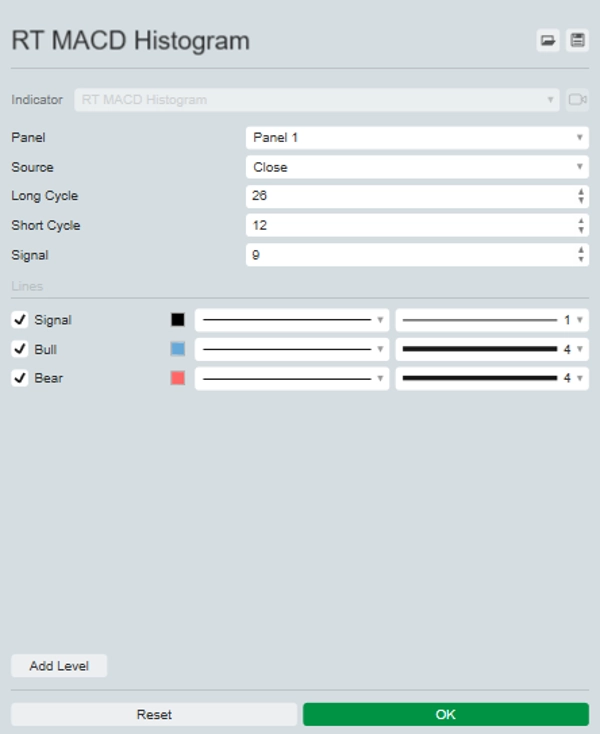
Ten ulepszony wskaźnik wyświetla żywy, kolorowy histogram, który rozróżnia bycze i niedźwiedzie zmiany cen, wykraczając poza domyślny jednokolorowy format. Dzięki zastosowaniu różnych kolorów dla ruchów pozytywnych i negatywnych, oferuje natychmiastową wskazówkę wizualną dotyczącą warunków rynkowych, ułatwiając interpretację zmian momentum i potencjalnych odwróceń trendu.
Idealny dla traderów poszukujących większej jasności i precyzji, ten Histogram MACD ulepszenie przekształca Twój wykres w potężniejsze narzędzie analityczne. Podnieś swoją strategię handlową dzięki ulepszonemu Histogramowi MACD.
Podsumowanie
Profil wskaźnika
Opinie klientów
0.0
Opinie: 0
Opinie klientów
Ten produkt nie ma jeszcze opinii. Wypróbowałeś(-aś) go już? Bądź pierwszy(-a) i powiedz o tym innym!
Dyskusja
Częste pytania
BTCUSD
Forex
Signal
Indices
EURUSD
Commodities
GBPUSD
NZDUSD
Prop
Scalping
Crypto
Stocks
XAUUSD
NAS100
MACD
USDJPY
Produkty dostępne za pośrednictwem cTrader Store, w tym boty handlowe, wskaźniki i wtyczki, dostarczane są przez deweloperów zewnętrznych i udostępniane wyłącznie w celach informacyjnych oraz w celu zapewnienia dostępu technicznego. cTrader Store nie jest brokerem i nie zapewnia doradztwa inwestycyjnego, nie udziela spersonalizowanych rekomendacji ani nie gwarantuje przyszłych wyników.


Cena
Od 25/09/2024
20
Sprzedaż