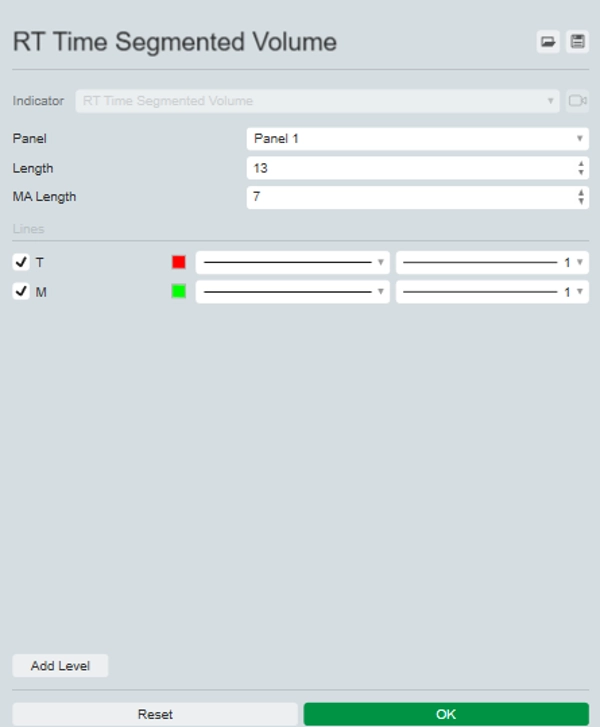
RT Time Segmented Volume
Gösterge
Sürüm 1.0, Sep 2024
Windows, Mac
Açıklama
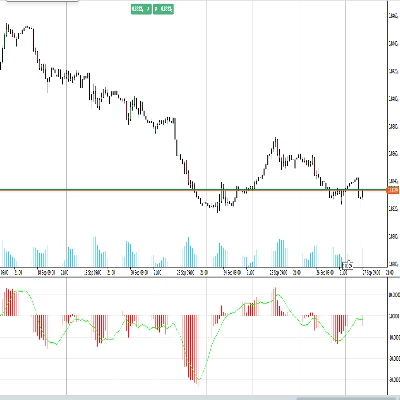
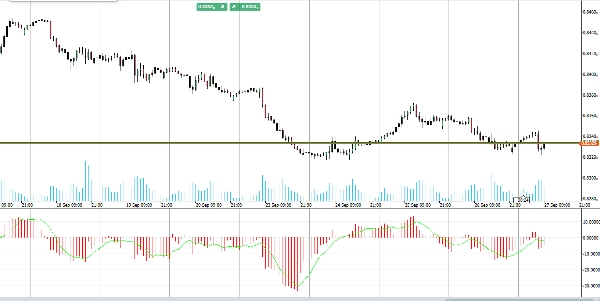
Tanıtıyoruz Zaman Segmentli Hacim (TSV) göstergesini, hacim akışı ve fiyat trendleri hakkında daha derin bilgilerle ticaret stratejinizi geliştirmek için tasarlandı.
TSV göstergesi, belirli bir zaman diliminde fiyat ve hacim arasındaki ilişkiyi ölçer, piyasadaki birikim ve dağıtım aşamalarını belirlemenize yardımcı olur.
Hisse senedi fiyatlarındaki trendleri belirlemek, destek ve direnç seviyelerini tespit etmek ve ticaret sinyallerini çözmek için kullanılır.
Analizlerini geliştirmek ve karar verme süreçlerini iyileştirmek isteyen yatırımcılar için mükemmel olan TSV göstergesi, piyasa dinamiklerini anlamak için güçlü bir araç sunar.
Üstün ticaret performansı için Zaman Segmentli Hacim göstergesi ile ticaret araç setinizi yükseltin.
Özet
Gösterge profili
Müşteri değerlendirmeleri
0.0
Değerlendirmeler: 0
Müşteri değerlendirmeleri
Bu ürün için henüz bir değerlendirme yok. Ürünü denediniz mi? O zaman ona dair görüşlerini paylaşan ilk kişi olun!
Tartışma
SSS
BTCUSD
Forex
Indices
EURUSD
Commodities
GBPUSD
NZDUSD
Prop
Crypto
Stocks
XAUUSD
NAS100
USDJPY
cTrader Store üzerinden erişilebilen işlem botları, göstergeler ve eklentiler gibi ürünler, üçüncü taraf sağlayıcılar tarafından sağlanır ve yalnızca bilgilendirme ve teknik erişim amaçlarıyla sunulur. cTrader Store bir broker değildir ve yatırım tavsiyesi, kişisel öneriler vermez veya gelecekteki performansı garanti etmez.


!["[Stellar Strategies] MARSI Signal Plotter" logosu](https://cdn.ctrader.com/image/webp/7b2b8da6-8f8e-4646-8d4a-4710c516c01e_25567)


Fiyat
Başlangıç 25/09/2024
20
Satışlar