
Description
Intrinsic Recursive Value Indicator
Overview
The Intrinsic Recursive Value is a custom indicator that utilizes recursive relative strength calculations over multiple periods to identify intrinsic market trends. It determines key price levels where trend strength reaches a critical level, offering insights into potential reversals and trend confirmations. The concept of Intrinsic Recursive Value is based on the idea that market momentum and trend strength can be recursively refined by applying multiple layers of price action analysis. This recursive approach helps identify deep-rooted bullish and bearish conditions that traditional price-based indicators might overlook.
Bullish & Bearish Trade Zones
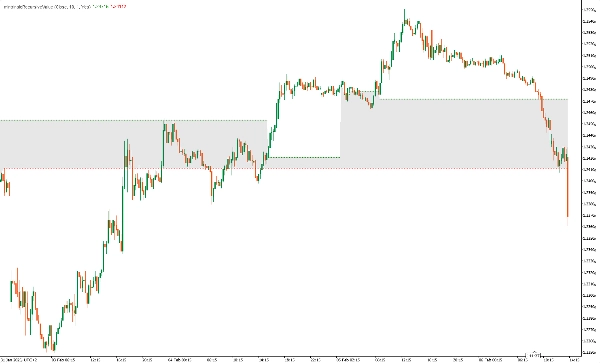
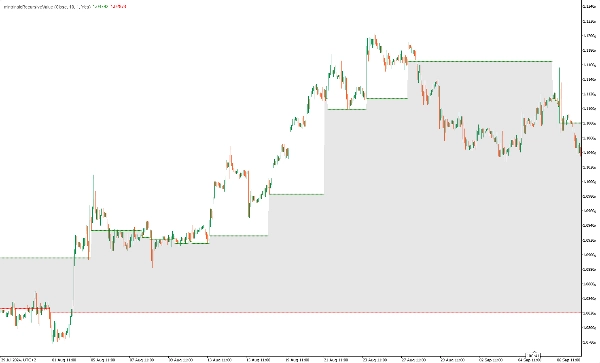
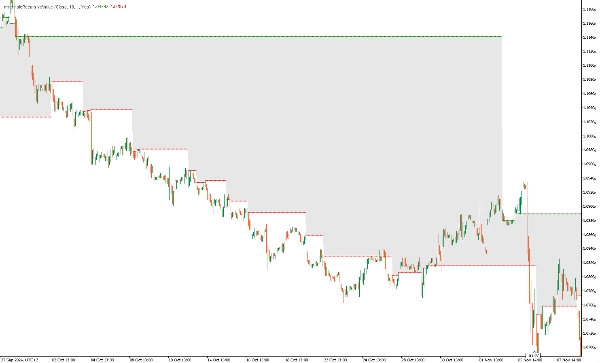
- Bullish Trade Zone: This zone is formed when the intrinsic recursive value confirms persistent bullish strength. It occurs when all recursive relative strength calculations indicate sustained values above equilibrium, suggesting strong upward momentum. The bullish trade zone helps traders identify potential long entry points and dynamic support areas where the price may continue to rise.
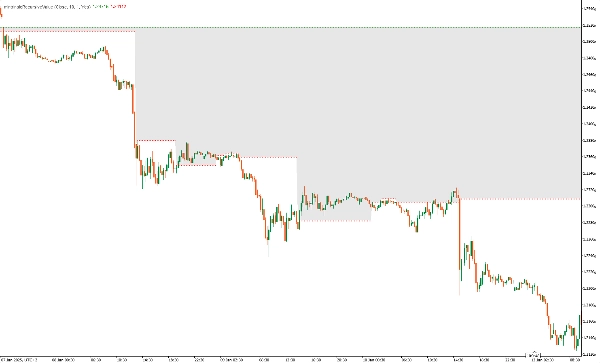
- Bearish Trade Zone: This zone is established when the intrinsic recursive value identifies continuous bearish strength. When all recursive relative strength values are below equilibrium, it signals an ongoing downtrend, providing traders with opportunities for short entries and defining dynamic resistance levels where price may continue to decline.
Indicator Outputs
- outIntrinsicRecursiveLong :Displays the intrinsic long level when bullish strength is detected.
- outIntrinsicRecursiveShort: Displays the intrinsic short level when bearish strength is detected.
Usage
- Trend Confirmation: Helps in identifying strong bullish or bearish trends when all relative strength periods align.
- Reversal Detection: Signals potential turning points when the intrinsic value shifts.
- Support & Resistance Levels: The intrinsic values act as dynamic support and resistance levels.
Example Trading Strategy
- Long Entry: Enter a long trade when the intrinsic long level is established and price action confirms bullish momentum, this mean the price is above the equilibrium value (indicator green component).
- Short Entry: Enter a short trade when the intrinsic short level is established and price action confirms bearish momentum, this mean the price is below the equilibrium value (indicator red component).
- Exit Strategy: Use trailing stops or the disappearance of intrinsic levels to exit trades
Notes
- The indicator is designed for trend-following strategies and works best in trending markets.
- It can be combined with other indicators such as momentum indicators for trigger trade confirmation.
Conclusion
The Intrinsic Recursive Value Indicator is a powerful tool for traders looking to enhance trend analysis using recursive relative strength calculations. By identifying key price levels with high probability trends, this indicator provides valuable insights into market direction and potential trade opportunities.
Summary
The indicator defines Bullish and Bearish Trade Zones: the Bullish Trade Zone signals sustained upward momentum when all recursive strength values exceed equilibrium, suggesting potential long entry points and dynamic support levels. Conversely, the Bearish Trade Zone indicates ongoing downtrends when values fall below equilibrium, identifying short entry opportunities and dynamic resistance levels.
Outputs include intrinsic long and short levels that display when bullish or bearish strength is detected. Use cases encompass trend confirmation, reversal detection, and identification of dynamic support and resistance levels. An example strategy involves entering long trades when intrinsic long levels align with bullish price action and short trades when intrinsic short levels coincide with bearish momentum, with exits managed via trailing stops or disappearance of intrinsic levels.
Designed primarily for trend-following strategies in trending markets, this indicator can be combined with other momentum tools for trade confirmation.


