
Descrição
Visualização de Tendência:
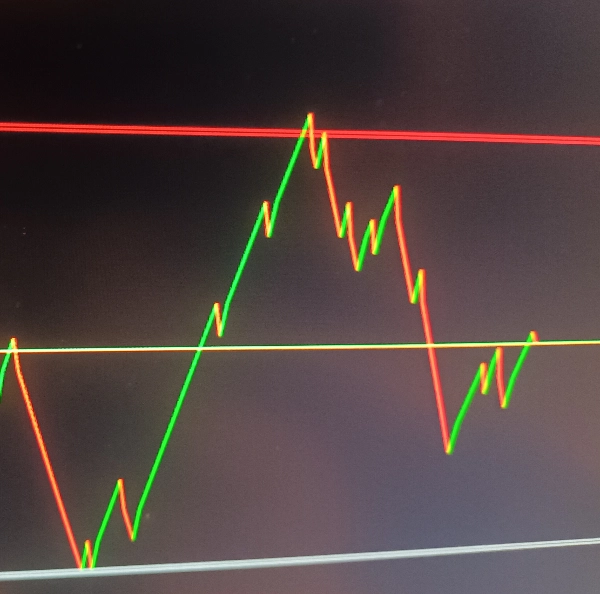
Desenha linhas de tendência (verde para alta, vermelho para baixa) com base nas mudanças de direção do preço
Plota uma linha de preço amarela no gráfico
Zonas de Suporte/Resistência:
Níveis configuráveis de suporte e resistência com espessura ajustável (em pips)
Cores personalizadas e opacidade para as zonas
Zonas interativas que podem ser ajustadas manualmente no gráfico
Sistema de Alertas:
Alertas de mudança de tendência (quando a direção do preço muda)
Alertas de toque nas zonas de suporte/resistência
Alertas sonoros personalizados para diferentes eventos
Suporte/Resistência Automático:
Ajuste automático opcional dos níveis de suporte/resistência quando as tendências mudam
Como Funciona
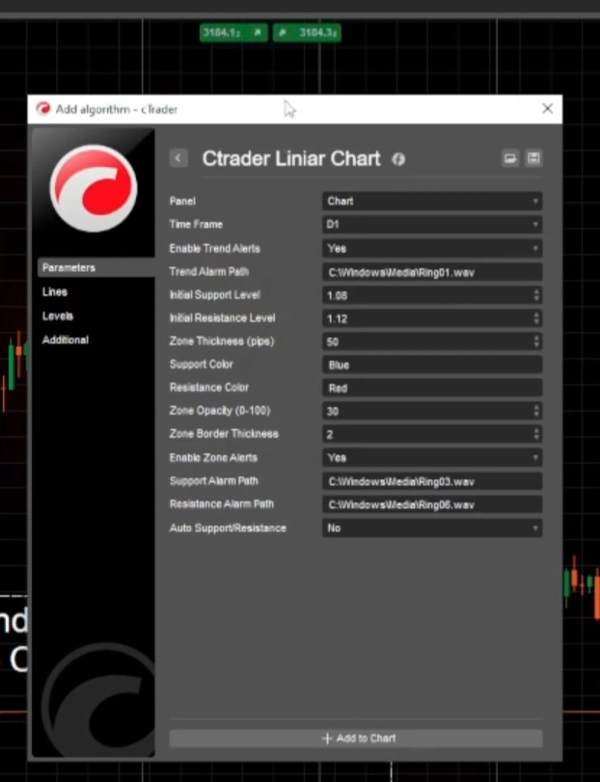
Configura o período selecionado (padrão é Diário)
níveis de suporte/resistência com valores padrão ou definidos pelo usuário
Inicia um temporizador para verificar periodicamente ajustes nas zonas
Lógica de Cálculo
Para cada barra, compara o preço de fechamento atual com o preço de fechamento anterior
Determina a direção atual da tendência (alta/baixa)
Desenha uma linha de tendência entre os preços atual e anterior
Se a direção da tendência mudar:
Atualiza opcionalmente os níveis de suporte/resistência automaticamente
Dispara alertas de tendência (se ativados)
Verifica se o preço entra nas zonas de suporte/resistência e dispara alertas conforme necessário
Gerenciamento de Zonas
Zonas de suporte/resistência são desenhadas como retângulos semi-transparentes
As zonas podem ser ajustadas manualmente no gráfico e o indicador acompanhará essas mudanças
A espessura da zona é configurável em pips
Tipos de Alertas
Alertas de Tendência: Disparados quando o preço muda de direção (alta/baixa)
Alertas de Zona: Disparados quando o preço entra nas zonas de suporte/resistência
Alertas de Nível Automático: Quando o suporte/resistência automático está ativado, alerta quando esses níveis são ajustados automaticamente
Seleção do período
Ativar/desativar diferentes tipos de alertas
Caminhos de arquivos de som personalizados para diferentes alertas
Nível de suporte/resistência.
Resumo
The indicator features configurable support and resistance zones displayed as semi-transparent rectangles, with adjustable thickness in pips, customizable colors, and opacity. These zones are interactive and can be manually adjusted on the chart, with the indicator tracking any changes.
An alert system notifies users of trend changes, price entries into support/resistance zones, and automatic adjustments of these levels if the auto-support/resistance feature is enabled. Alerts can be customized with different sound files and can be enabled or disabled individually.
The indicator periodically checks for zone adjustments and updates support/resistance levels automatically when trends change, if configured. It supports time frame selection and provides a comprehensive visual and alert-based approach to monitoring price trends and critical levels in trading charts.


