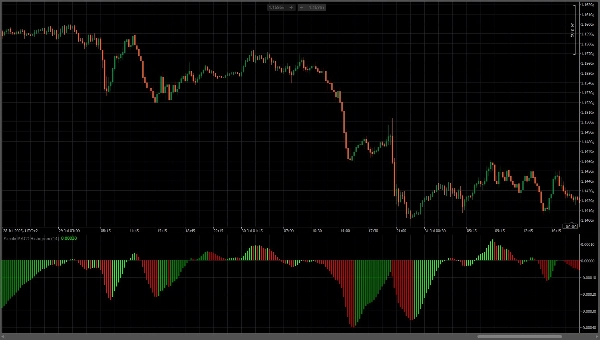
Simple MACD Histogram
Logótipo de "Simple MACD Histogram"
03/08/2025
62
Desktop
Desde 15/06/2025
Instalações gratuitas
195
Imagem carregada de "Simple MACD Histogram"

This custom MACD Histogram indicator displays the MACD histogram with enhanced visual clarity styling. The indicator uses a fast EMA period of 14, automatically calculates the slow EMA as fast plus 2 (16). The indicator features highly contrasted color-coding for instant trend recognition: bright green bars indicate rising momentum (bullish), while red bars show falling momentum (bearish). The histogram bars extend symmetrically from a center zero line, creating an intuitive visual representation where green signals buy pressure and red signals sell pressure. This visualization style provides clear, unambiguous momentum signals and helps identify potential trend reversals and momentum shifts in price action.

0.0
Avaliações: 0
Avaliações de clientes
Ainda não há avaliações para este produto. Já o experimentou? Seja o primeiro a contar a outras pessoas!
Mais deste autor
Flex VWAP
Flexible VWAP indicator with timezone-aware, custom time periods and automatic DST handling.
Também poderá gostar de
Indicador
RSI
Indices
Signal
QQE-MTF
Multi-timeframe version of the Quantitative Qualitative Estimation (QQE) indicator.
Indicador
RSI
Indices
StochasticRSI
Stochastic RSI (StochRSI) is a technical indicator used to measure the strength and weakness of the RSI.
VegaXLR - RSI and StochRSI Alerts
VegaXLR's cTrader StochRSI identifies overbought/oversold RSI levels for precise trade entries.
Indicador
VWAP
Indices
Forex
TPO Profile v2.0
TPO Profile v2.0
Indicador
Indices
Stocks
Commodities
+2
Series - FXMaster
Consecutive Series Moves — Reveal the True Pulse of Price Action
VWAP - London Open
VWAP Set to London Open
Indicador
Indices
RSI
Signal
+1
[Stellar Strategies] QQE
The QQE indicator is a technical analysis tool designed to identify potential trend changes and trading signals 📈📉
Order Block detector PRO
Order Block PRO — Smart Institutional Zone Detector
Indicador
Breakout
Fx4U.Multi TimeFrame Support & Resistance
Allow trader to visualize Support & Resistance across different timeframes,give trader an overview of the current market
Indicador
VWAP
XAUUSD
Forex
+2
Dynamic Swing Anchored VWAP
Daily Open Pivot Level
This indicator is a valuable tool for traders looking to identify significant opening price level of any asset.
Indicador
Breakout
AI
Scalping
KaufmanEfficiencyRatio
A precision tool for measuring how efficiently price moves from point A to B.
IR Ichimoku Macd
this indicaotr show distance between Tenkan to Kijun, Close to Kijun and Close to Tenkan 
Indicador
Indices
XAUUSD
Stocks
+5
cAlgoBuddy - Ultimate Candlestick Patterns
The ultimate candlestick suite is here to help you detect most of the candlestick patters that exist today.
Indicador
RSI
Signal
MACD
[Stellar Strategies] Moving Averages Combined 1.0
Smooths price action with 6 MAs (3 SMA, 3 EMA). Reduces noise, clarifies trends 📈📉
Candlestick Patterns - Special Candles
Boost your trading with Candlestick Patterns for cTrader – auto-detect key signals for smarter, faster decisions!
Indicador
Grid
RSI
XAUUSD
+12
PFO Price Flow Oscillator
technical analysis tool designed to provide traders with a structured view of market momentum and volatility
IR VLine
don't move to the end of chart after timeframe changing. it should be better to use for near history. for long history