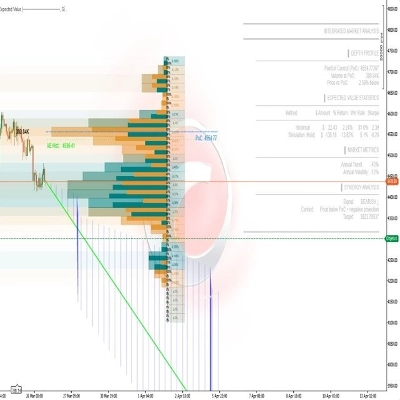
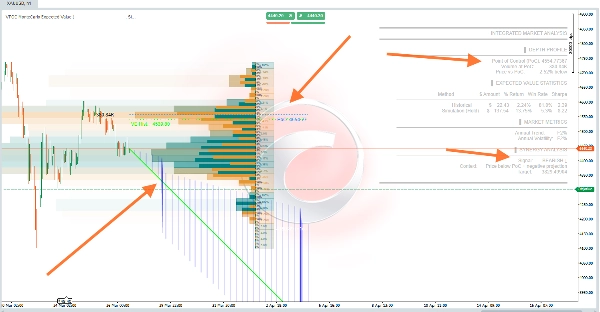
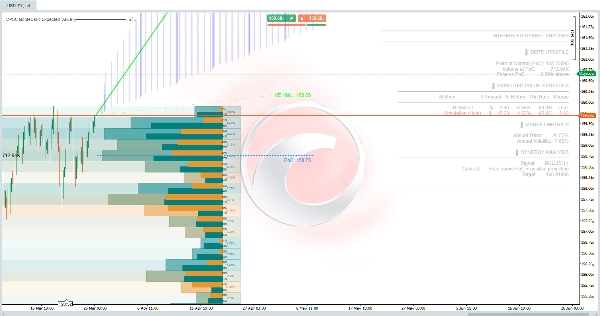
Mô tả
📊 GIÁ TRỊ KỲ VỌNG MONTE CARLO VPOC
https://chartshots.spotware.com/c/69c558e2c68df
Phân tích Thị trường Tích hợp: Hồ sơ Khối lượng + Dự báo Thống kê 🎯
🎯 NÓ LÀ GÌ?
Giá trị kỳ vọng Monte Carlo VPOC là một chỉ báo phân tích định lượng kết hợp hai phương pháp giao dịch chuyên nghiệp:
- Hồ sơ Độ sâu Thị trường (VPOC) - Xác định nơi khối lượng thực sự tập trung 🏦
- Mô phỏng Monte Carlo - Dự báo các kịch bản tương lai dựa trên xác suất thống kê 📈
Kết quả là một hệ thống phân tích cho bạn biết tiền đang ở đâu (Điểm Kiểm soát) và nó có khả năng đi đâu (Giá trị Kỳ vọng dự kiến) 🧠
⚙️ NÓ HOẠT ĐỘNG NHƯ THẾ NÀO?
Mô-đun 1: Hồ sơ Độ sâu (VPOC) 📊
Chỉ báo phân tích 200 thanh cuối cùng (có thể cấu hình) và phân phối khối lượng trên 30 mức giá. Nó tính toán:
- Điểm Kiểm soát (PoC): Giá có khối lượng giao dịch cao nhất - đại diện cho sự đồng thuận thị trường nơi người mua và người bán hoạt động tích cực nhất ⚖️
- Delta: Sự khác biệt giữa áp lực mua và bán ở mỗi mức 🔄
- Bản đồ nhiệt: Hình ảnh hóa sự tập trung hoạt động 🔥
Logic: Giá có xu hướng quay về PoC vì đó là nơi phần lớn thanh khoản đang chờ. Nếu giá cách xa PoC, có xác suất cao sẽ quay lại 🔄
Mô-đun 2: Dự báo Thống kê (Monte Carlo) 🎲
Sử dụng mô phỏng ngẫu nhiên (mặc định 1.000 lần lặp) để dự báo giá tương lai:
- Tính toán xu hướng lịch sử và độ biến động hàng năm của tài sản 📉📈
- Tạo các đường đi ngẫu nhiên sử dụng phân phối chuẩn (mô hình chuyển động Brown hình học) 🌊
- Ước tính Giá trị Kỳ vọng với các dải độ lệch chuẩn (±1 sigma) 📏
Công thức áp dụng: - Độ trôi dạt mỗi thanh = Lợi nhuận hàng năm / số ngày giao dịch 🧮
- Độ biến động mỗi thanh = Độ biến động hàng năm / √số ngày ⚡
- Dự báo = Giá hiện tại × e^(tổng độ trôi dạt + ngẫu nhiên chuẩn × tổng độ biến động) 🔢
Mô-đun 3: Tương tác 🔗
Kết hợp cả hai phân tích để tạo ra các tín hiệu ngữ cảnh:
Bảng
Tín hiệu Điều kiện Ý nghĩa
TĂNG GIÁ ↑ 🟢 Giá > PoC + Dự báo tích cực Xu hướng tăng được xác nhận bởi khối lượng
GIẢM GIÁ ↓ 🔴 Giá < PoC + Dự báo tiêu cực Xu hướng giảm được xác nhận bởi khối lượng
CƠ HỘI ★ 💡 Giá < PoC + Dự báo tích cực Có thể bật lên từ hỗ trợ khối lượng
PHÂN KỲ ⚠️ ⚠️ Giá > PoC + Dự báo tiêu cực Cảnh báo khả năng đảo chiều
📈 NÓ ĐƯỢC SỬ DỤNG ĐỂ LÀM GÌ?
✅ Xác định các mức khối lượng chính - PoC hoạt động như nam châm giá 🧲
✅ Ước tính xác suất thành công - Tỷ lệ phần trăm các kịch bản thắng trong mô phỏng 🏆
✅ Đánh giá rủi ro/lợi nhuận - Tỷ lệ Sharpe dự kiến và độ lệch chuẩn 📊
✅ Xác nhận hướng giao dịch - Tương tác giữa vị trí so với PoC và động lượng thống kê 🎯
✅ Mục tiêu dự báo - Các mức giá kỳ vọng cho khoảng thời gian giữ định nghĩa 🎯
🎮 CẤU HÌNH VÀ SỬ DỤNG
Các Tham số Chính:
Bảng
Nhóm Tham số Mặc định Mô tả
Phân tích Hồ sơ Độ sâu 200 thanh Lịch sử để tính hồ sơ khối lượng
Mức Giá 30 Độ phân giải hồ sơ (nhiều mức hơn = chi tiết hơn) 🔍
Độ lệch Ngang 5 Vị trí hồ sơ trên biểu đồ 📏
Dự báo Thống kê Thời gian Hoạt động Tối đa 252 thanh Khoảng thời gian dự báo ⏱️
Vốn Đầu tư $1,000 Cơ sở cho các tính toán tiền tệ 💰
Số lần Mô phỏng 1,000 Số đường đi ngẫu nhiên (nhiều hơn = chính xác hơn, chậm hơn) 🔄
Tỷ lệ Không Rủi ro 5% Để tính Tỷ lệ Sharpe 📉
Chiến lược Lịch sử Sử dụng TP/SL Không Kích hoạt để mô phỏng với mục tiêu cố định 🎯
Cách Diễn giải Bảng Kết quả:
plain
Copy
THỐNG KÊ GIÁ TRỊ KỲ VỌNG
┌──────────────┬─────────┬─────────┬─────────┬────────┐
│ Phương pháp │ Số tiền $│ % Lợi nhuận│ Tỷ lệ Thắng│ Sharpe │
├──────────────┼─────────┼─────────┼─────────┼────────┤
│ Lịch sử │ -$19.56 │ -1.96% │ 47.2% │ -1.24 │
│ Mô phỏng │ -$54.05 │ -5.40% │ 21.4% │ -4.95 │
└──────────────┴─────────┴─────────┴─────────┴────────┘
- Lịch sử: Hiệu suất trung bình của các giao dịch tương tự trong quá khứ 📜
- Mô phỏng: Kết quả trung bình của 1.000 mô phỏng Monte Carlo 🎲
- Tỷ lệ Thắng: Tỷ lệ phần trăm các kịch bản có kết quả tích cực ✅
- Sharpe: Lợi nhuận điều chỉnh theo rủi ro (lớn hơn 1 là tốt, âm là xấu) 📈
🖼️ Các Yếu tố Trực quan trên Biểu đồ
Bảng
Yếu tố Màu sắc Ý nghĩa
Hồ sơ khối lượng Gradient cam/xanh Tập trung hoạt động theo mức giá 🎨
Đường PoC Chấm xanh Điểm Kiểm soát dự kiến trong tương lai 🔵
Đường dự báo EV Xanh lá/Magenta Quỹ đạo giá kỳ vọng 🟢🔴
Dải ±1σ Đường chấm trắng Phạm vi tin cậy 68% 📊
Đường EV lịch sử Chấm xanh Giá trị kỳ vọng dựa trên dữ liệu lịch sử 🟢
Vùng dự báo Màu xanh trong suốt Khu vực xác suất giữa các dải 🔵
⚠️ QUAN TRỌNG - Giới hạn
- Không phải tín hiệu mua/bán - Đây là công cụ phân tích xác suất 🛠️
- Mô phỏng Monte Carlo giả định phân phối lịch sử giữ nguyên (không dự đoán các sự kiện thiên nga đen) 🦢❌
- PoC là động - Tính toán lại trên mỗi thanh mới 🔄
- Cần đủ lịch sử - Tối thiểu 252 thanh để dự báo đáng tin cậy 📊
- Tiền điện tử - Chỉ báo tự động điều chỉnh 365 ngày giao dịch hàng năm so với 252 ngày của thị trường truyền thống 🪙
💡 Chiến lược Sử dụng Đề xuất
- Tìm CƠ HỘI ★ 💡 - Giá dưới PoC nhưng có dự báo tích cực (có thể bị định giá thấp)
- Xác nhận với Tỷ lệ Thắng > 50% - Xác suất thành công thống kê cao hơn ✅
- Tránh PHÂN KỲ ⚠️ ⚠️ - Giá bị định giá quá cao so với khối lượng thực tế
- Sử dụng PoC làm tham chiếu - Dừng lỗ hoặc mục tiêu quanh mức thanh khoản này 🎯
- So sánh Lịch sử và Mô phỏng - Nếu khác biệt lớn, chế độ thị trường đang thay đổi 🔄
Tóm tắt
Using Monte Carlo simulations with default 1,000 iterations, it projects future price scenarios based on historical trends and volatility, applying a geometric Brownian motion model. This generates expected price trajectories with confidence bands (±1 standard deviation), estimating probabilities of success, risk-adjusted returns (Sharpe ratio), and potential target levels.
The combined analysis produces contextual signals such as Bullish, Bearish, Opportunity, and Divergence, based on price relation to PoC and projection direction. It supports various markets including Forex, stocks, commodities, indices, and cryptocurrencies, adjusting parameters like trading days accordingly.
Key configurable settings include analysis period, profile resolution, simulation count, and risk-free rate. Visual elements on the chart display volume profiles, PoC lines, expected value projections, and confidence intervals. The tool is designed for probabilistic market assessment and trade confirmation rather than direct buy/sell signals.
Đánh giá của khách hàng
5 | 0 % | |
4 | 0 % | |
3 | 0 % | |
2 | 0 % | |
1 | 100 % |