
R S
Indikator
65 unduhan
Versi 1.0, Jul 2025
Windows, Mac
Deskripsi
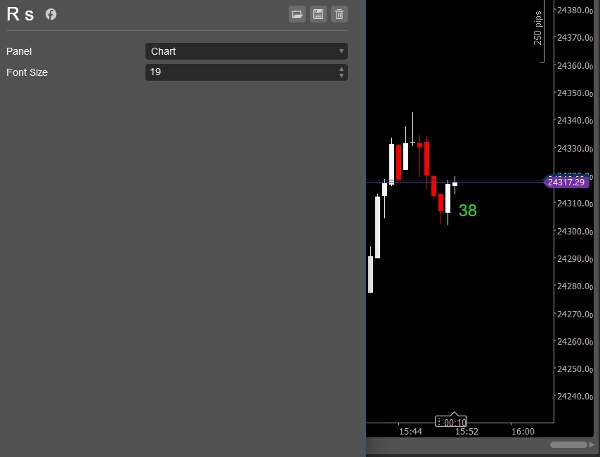
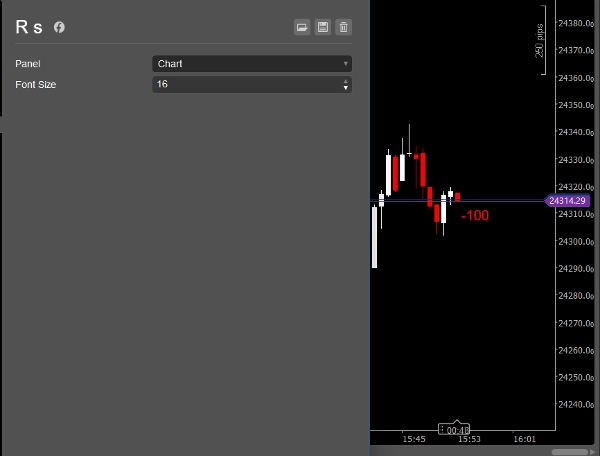
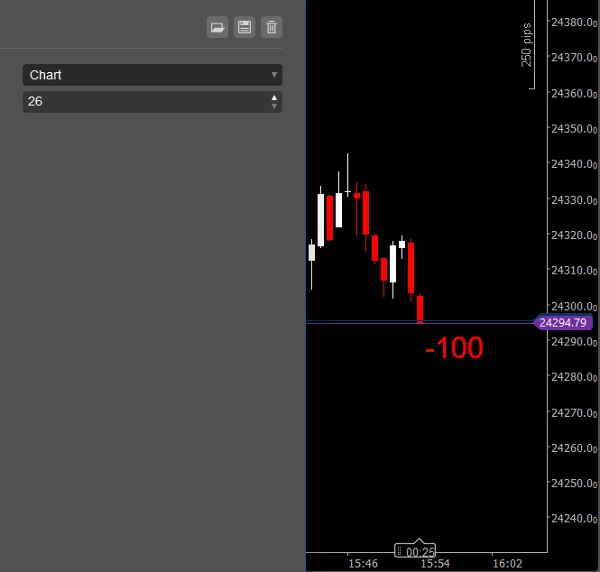
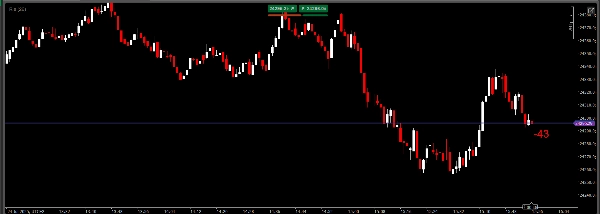
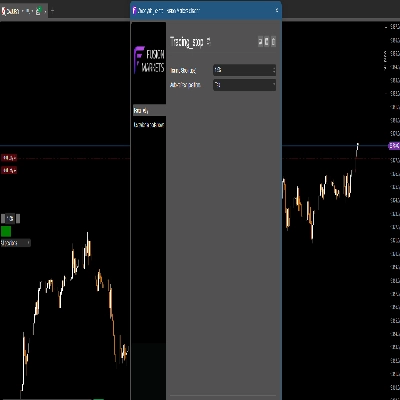
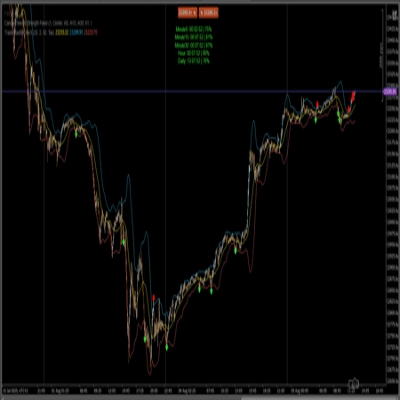
- Indikator ini adalah alat sederhana dengan satu kerangka waktu untuk menunjukkan sentimen candle langsung di grafik Anda.
Jika Anda menginginkan solusi yang lebih canggih dengan multi-kerangka waktu dan fitur profesional, lihat produk saya yang lain: - Candle Timer & Strength – lihat timer candle dan kekuatan pada beberapa kerangka waktu, tepat di samping harga.
- Candle Timer & Strength Panel – dashboard yang selalu terlihat dengan timer dan kekuatan candle untuk hingga 5 kerangka waktu, dipasang di bagian atas grafik Anda.
- ZigZag Pro – indikator swing dan struktur pasar yang canggih, sempurna untuk dikombinasikan dengan alat sentimen.
Gabungkan Candle Timer & Strength Panel dengan ZigZag Pro untuk pandangan lengkap tentang sentimen pasar, waktu, dan struktur!
Temukan semua indikator dan bot saya di sini:
https://ctrader.com/pl?search=kobud.222&u=kobud.222
http://www.youtube.com/@Robi22-22
📩 Pertanyaan? Saran? Diskon?
Kontak tersedia di profil saya: Robikobud
Ringkasan
Ringkasan AI
R S is a simple, single-timeframe indicator designed to display candle sentiment directly on trading charts. It provides a straightforward visualization of market sentiment based on individual candlesticks within the selected timeframe. This tool is intended for users seeking a basic sentiment indicator without multi-timeframe complexity. For more advanced analysis, the developer offers additional products that include multi-timeframe candle timers, strength indicators, and market structure tools. R S integrates seamlessly into charting platforms to assist traders in quickly assessing candle-based sentiment during their technical analysis.
Profil indikator
Ulasan pelanggan
0.0
Ulasan: 0
Ulasan pelanggan
Belum ada ulasan untuk produk ini. Sudah mencobanya? Jadilah pemberi ulasan pertama!
Diskusi
Pertanyaan umum
Produk-produk yang tersedia melalui cTrader Store, termasuk bot trading, indikator, dan plugin, disediakan oleh pengembang pihak ketiga serta hanya ditujukan untuk akses teknis dan informasi. cTrader Store bukan broker dan tidak menyediakan saran investasi, rekomendasi pribadi, atau jaminan apa pun tentang kinerja di masa mendatang.
Produk lain dari penulis ini


![Logo "[Stellar Strategies] MARSI Signal Plotter"](https://cdn.ctrader.com/image/webp/7b2b8da6-8f8e-4646-8d4a-4710c516c01e_25567)


Harga
Sejak 31/12/2024
7
Penjualan
1.14K
Instal gratis