Descrição
Modelo de Reversão de Momentum (MRM) é um indicador técnico que visualiza zonas potenciais de reversão de momentum na ação do preço.
Ele analisa a estrutura interna do movimento do mercado para destacar áreas onde a pressão de venda pode começar a diminuir e o momentum de recuperação pode surgir.
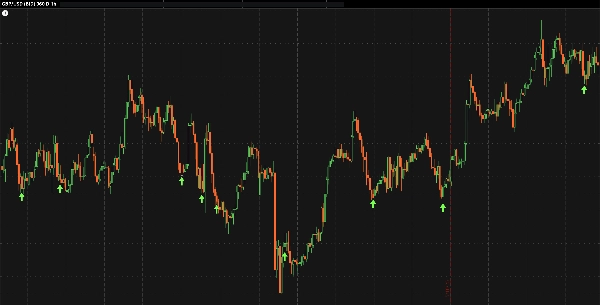
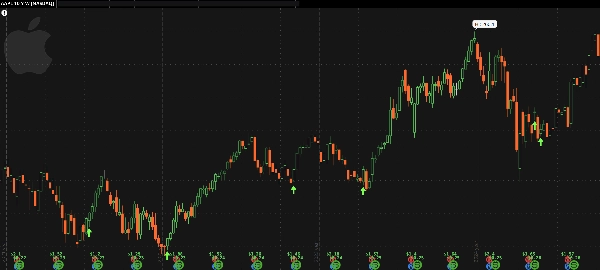
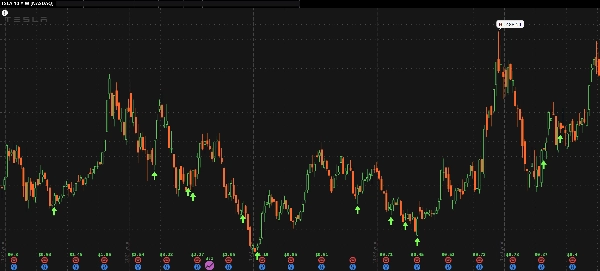
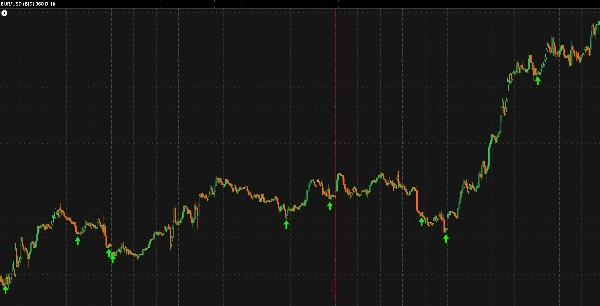
Quando as condições do seu modelo interno se alinham, o MRM plota uma seta verde abaixo da barra de preço — marcando um possível ponto de reversão.
Embora projetado principalmente para mercados forex em gráficos de 1 hora, também pode ser aplicado a dados semanais de ações para observar comportamento analítico semelhante em diferentes prazos.
Este indicador não abre nem gerencia operações. Ele fornece uma camada visual de confirmação que pode complementar estratégias técnicas existentes ou configurações discricionárias.
Características principais:
- Destaca pontos potenciais de exaustão e recuperação no momentum
- Adapta-se internamente a ambientes de volatilidade variáveis
- Parâmetros mínimos para comportamento analítico consistente
💬 Sua opinião é importante:
Se você achar esta ferramenta útil, por favor, considere deixar uma breve avaliação na Loja.
Se você gostaria de ver cBots baseados em MRM publicados no futuro, sinta-se à vontade para mencioná-lo em seu feedback — o interesse da comunidade ajuda diretamente a orientar lançamentos futuros.
Aviso legal:
O Modelo de Reversão de Momentum é fornecido gratuitamente para fins analíticos e educacionais apenas.
Ele não constitui aconselhamento financeiro, orientação de negociação ou recomendação para comprar ou vender qualquer instrumento.
Nenhuma garantia é dada quanto à precisão, desempenho ou resultados.
Todas as decisões de negociação permanecem inteiramente sob o risco do usuário, e nenhuma responsabilidade é aceita por qualquer perda ou dano decorrente do seu uso.