
Trend Cycle
Indicador
174 transferências
Versão 1.0, Nov 2025
Windows, Mac
Descrição
Trend Cycle é uma ferramenta de análise de tendências que foca na duração da tendência, não apenas na direção.
Ela:
- Detecta tendências de alta e de baixa com base na inclinação de uma Média Móvel Hull (HMA).
- Conta quantas barras a tendência atual está ativa (Comprimento Real).
- Armazena os comprimentos das recentes tendências de alta e de baixa separadamente.
- Calcula o comprimento médio das tendências de alta e baixa (Média Alta / Média Baixa).
- Desenha:
-
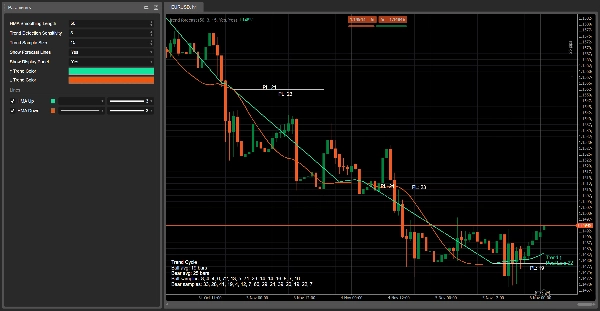
- Uma HMA verde durante tendências de alta e HMA vermelha durante tendências de baixa.
- Linhas de projeção horizontais no início de cada tendência, com um rótulo como
PL: 18(Comprimento Provável em barras). - Um rótulo ao vivo próximo ao preço atual mostrando a direção da tendência e o Comprimento Real.
- Um painel de exibição com:
-
- duração média das tendências de alta e baixa,
- listas dos comprimentos recentes das tendências (até o tamanho da amostra selecionada).
O objetivo é ajudar você a responder:
“Quão antiga é esta tendência, e quanto tempo tendências como esta geralmente duram?”
Como funciona (lógica)
- Média Móvel Hull (HMA)
O indicador calcula uma Média Móvel Hull do preço de fechamento usando o parâmetro Comprimento de Suavização HMA.
A HMA é mais suave que uma média simples/EMA, mas responde rapidamente às mudanças de direção. - Detecção de tendência pela inclinação
Nas últimas barras de Sensibilidade de Detecção de Tendência, verifica a HMA:
Enquanto uma tendência estiver definida, um contador (Real Len) é incrementado a cada barra, representando a duração da tendência atual. -
- Se a HMA estiver estritamente subindo → a tendência é de alta (↑).
- Se a HMA estiver estritamente caindo → a tendência é de baixa (↓).
- Caso contrário, mantém o estado anterior da tendência.
- Registro dos comprimentos das tendências
Quando a tendência muda de alta para baixa ou vice-versa: -
- A duração da tendência concluída é armazenada:
-
- tendências de alta na lista de alta,
- tendências de baixa na lista de baixa.
- Cada lista é limitada pelo Tamanho da Amostra de Tendência (ex: últimas 10 tendências).
- Essas amostras são usadas para calcular:
-
- Média Alta = comprimento médio das tendências de alta.
- Média Baixa = comprimento médio das tendências de baixa.
- Projeções de Comprimento Provável
No início de cada nova tendência, se houver amostras suficientes:
Essas projeções são mantidas no gráfico como histórico para que você possa comparar visualmente as durações previstas vs reais das tendências. -
- Calcula o comprimento médio para esse tipo de tendência (alta ou baixa).
- Desenha uma linha horizontal a partir da barra de início da tendência por aproximadamente esse número de barras.
- Coloca um rótulo no centro da linha:
-
PL: X→ Comprimento Provável = X barras.
- Rótulo ao vivo
A cada barra, o indicador desenha um único rótulo ao vivo próximo à HMA:
Isso mostra a direção atual da tendência e exatamente quantas barras ela durou até agora. -
- Exemplo de texto:
-
Trend ↑
Real Len: 7
- Cor:
-
- Verde (↑) para tendências de alta
- Laranja/vermelho (↓) para tendências de baixa
- Painel de exibição (inferior esquerdo)
Quando Mostrar Painel de Exibição está ativado, um painel de texto estático aparece no canto do gráfico mostrando:
Isso serve como uma visão estatística rápida do comportamento recente das tendências nesse símbolo/prazo. -
- Título: Trend Cycle
Média Alta: X barrasMédia Baixa: Y barrasAmostras de alta:lista dos comprimentos recentes das tendências de altaAmostras de baixa:lista dos comprimentos recentes das tendências de baixa
Como ler na prática
- HMA verde + “Trend ↑”
→ Uma tendência de alta está ativa.
→Real Lenindica quantas barras ela durou até agora.
→ A linha mais recentePL: Xdá uma ideia visual de quanto tempo tendências de alta similares costumam durar. - HMA vermelha + “Trend ↓”
→ Uma tendência de baixa está ativa.
→Real Len= idade da tendência de baixa atual.
→ Compare Real Len comMédia Baixano painel para ver se o movimento é jovem ou maduro. - Quando Real Len se aproxima ou excede a média (Média Alta / Média Baixa):
→ A tendência atual é estatisticamente “antiga” comparada ao histórico recente.
→ Você pode optar por: -
- apertar os stops,
- realizar lucros,
- ser mais cauteloso com novas entradas nessa direção.
- Tendências curtas vs tendências longas
-
- Muitas tendências muito curtas → ambiente instável / de reversão à média.
- Poucas tendências longas → mercado mais direcional, com movimentos estendidos.
Resumo
Resumo de IA
Trend Cycle is a technical indicator designed to analyze trend duration in financial markets. It detects bullish and bearish trends by evaluating the slope of a Hull Moving Average (HMA) applied to closing prices, providing a smoother yet responsive measure of trend direction. The indicator counts the number of bars the current trend has been active (Real Length) and records the lengths of recent up-trends and down-trends separately. Using these samples, it calculates average durations for bullish and bearish trends.
Visual elements include a green HMA line during bullish trends and a red HMA line during bearish trends. Horizontal projection lines mark the probable length of each trend at its start, labeled with "PL: X" to indicate expected duration in bars. A live label near the current price displays the active trend direction and its age in bars. An optional display panel offers a summary of average trend durations and recent trend length samples.
Trend Cycle helps users assess how long the current trend has lasted relative to historical trends, aiding decisions such as adjusting stops or managing entries. It supports analysis across various markets including Forex, cryptocurrencies, indices, commodities, and stocks.
Perfil do indicador
Avaliações de clientes
0.0
Avaliações: 0
Avaliações de clientes
Ainda não há avaliações para este produto. Já o experimentou? Seja o primeiro a contar a outras pessoas!
Conversa
Perguntas frequentes
BTCUSD
Forex
Signal
Breakout
Indices
EURUSD
Commodities
GBPUSD
NZDUSD
Martingale
Bollinger
Prop
ZigZag
Scalping
Supertrend
Crypto
Grid
Stocks
AI
XAUUSD
NAS100
USDJPY
Os produtos disponíveis através da cTrader Store, incluindo bots de negociação, indicadores e plugins, são fornecidos por programadores terceiros e são disponibilizados apenas para fins informativos e de acesso técnico. A cTrader Store não é um corretor e não fornece aconselhamento em matéria de investimento, recomendações pessoais ou qualquer garantia de desempenho no futuro.


Preço
42.11M
Volume negociado
6.13M
Pips ganhos
211
Vendas
8.13K
Instalações gratuitas