Descrição
Análise Profissional de Volume Baseada em Intervalos com Cálculo Inteligente de Delta por Vela
Desbloqueie o poder da análise precisa de volume com RANGE DELTA CANDLE VOLUME PROFILE, o indicador definitivo de perfil de volume baseado em intervalos para cTrader. Projetado para traders que precisam de análise de volume flexível e precisa em intervalos de tempo personalizados, este indicador oferece insights de nível institucional por meio do cálculo inteligente de delta baseado em velas.
🎯 PRINCIPAIS RECURSOS
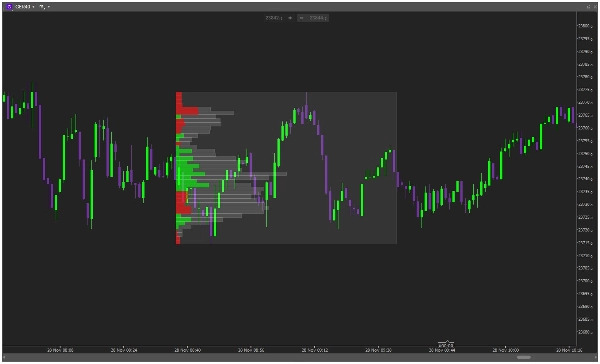
🏓 ANCORAGEM FLEXÍVEL DE INTERVALO
- Use linhas de tendência para definir QUALQUER intervalo de tempo personalizado
- Geração dinâmica de perfil entre os pontos escolhidos
- Atualizações em tempo real conforme o mercado se desenvolve
- Opções de ancoragem à esquerda ou à direita
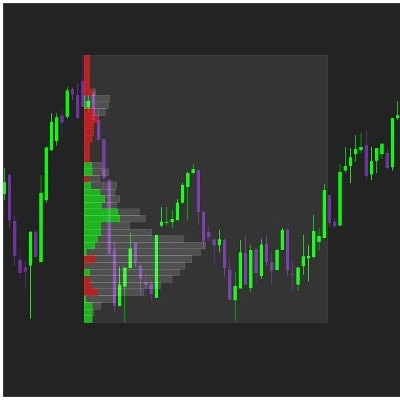
📊 ANÁLISE INTELIGENTE DE DELTA BASEADA EM VELAS
- Cálculo avançado de delta baseado na direção da vela
- Velas verdes = Volume de Compra | Velas vermelhas = Volume de Venda
- Visualização limpa e monocromática por nível de preço
- Identificação instantânea de zonas de acumulação/distribuição
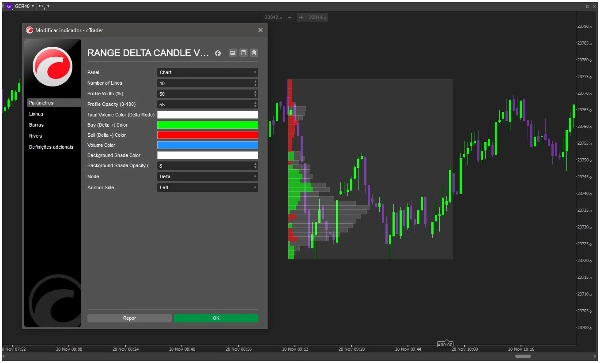
🎨 EXIBIÇÃO TOTALMENTE PERSONALIZÁVEL
- Número ajustável de bins/linhas (5-100)
- Largura do perfil personalizável (5-300% do intervalo)
- Controle completo de cores para volume de compra/venda/total
- Configurações de transparência e opacidade
⚡ MODOS DE EXIBIÇÃO DUPLOS
- Modo Delta: Visualize a pressão líquida de compra/venda
- Modo Volume: Exibição tradicional do perfil de volume
- Escolha entre ancoragem à esquerda ou à direita
🚀 POR QUE OS TRADERS ESCOLHEM ESTE
"A flexibilidade para analisar qualquer intervalo personalizado é revolucionária. Perfeito para análise de sessões e movimentos-chave do mercado." - Trader Profissional de Day Trade
"Finalmente, um perfil de volume por intervalo que realmente faz sentido. O delta baseado em velas é incrivelmente preciso." - Trader de Swing
📈 IDEAL PARA
- Análise de Sessões - Analise sessões de negociação específicas (Londres, NY, Ásia)
- Negociação Baseada em Eventos - Estude o volume em torno de notícias e dados econômicos
- Análise Técnica - Confirme suportes/resistências com validação de volume
- Estrutura de Mercado - Identifique áreas de valor e lacunas de volume
🛠 SIMPLES DE USAR
- Desenhe uma linha de tendência entre seus pontos inicial e final
- Observe enquanto o perfil de volume é gerado automaticamente
- Analise a distribuição do delta ao longo do seu intervalo personalizado
- Negocie com níveis e insights confirmados por volume
🔧 ESPECIFICAÇÕES TÉCNICAS
- Cálculo e atualizações em tempo real
- Baixo consumo de recursos
- Compatível com todos os intervalos de tempo
- Funciona com todos os instrumentos de negociação
📋 OPÇÕES DE PERSONALIZAÇÃO
- Número de Bins/Linhas
- Porcentagem da Largura do Perfil
- Controles de Opacidade (0-100%)
- Esquemas de Cores Personalizados
- Seleção do Lado da Ancoragem (Esquerda/Direita)
- Modo de Exibição (Delta/Volume)
🎯 ELEVE SUA ANÁLISE DE MERCADO HOJE!
Junte-se a traders profissionais em todo o mundo que transformaram sua análise de mercado com RANGE DELTA CANDLE VOLUME PROFILE. Pare de usar ferramentas rígidas de intervalo fixo e comece a analisar o volume exatamente onde você precisa.
⭐ "A capacidade de analisar intervalos personalizados com cálculo preciso de delta mudou completamente minha abordagem à estrutura de mercado. Ferramenta essencial!"
Adicione RANGE DELTA CANDLE VOLUME PROFILE à sua plataforma cTrader hoje e domine a análise de volume em qualquer condição de mercado!
🆚 POR QUE ESCOLHER ESTE EM VEZ DE OUTROS PERFIS DE VOLUME?
- ✅ Verdadeira Flexibilidade - Analise QUALQUER intervalo de tempo personalizado
- ✅ Delta Preciso - Cálculo baseado em velas para resultados confiáveis
- ✅ Visualização Profissional - Exibição limpa e de nível institucional
- ✅ Personalização Real - Controle completo sobre todos os aspectos visuais
- ✅ Metodologia Comprovada - Baseada em princípios profissionais de negociação
Transforme sua análise gráfica com o poder do perfil de volume flexível baseado em intervalos!


![Logótipo de "[Hamster-Coder] Pivot Points MTF"](https://cdn.ctrader.com/image/webp/4c143e5a-309c-40e3-a578-f04d1e133ffa_31159)

![Logótipo de "[Hamster-Coder] Bollinger Bands"](https://cdn.ctrader.com/image/webp/21d8e5d6-fb11-4bac-b9ee-cd05c2b76804_30327)


