Linhas de Tendência Lux-Style com Rompimentos – Indicador cTrader
Traga linhas de tendência dinâmicas baseadas em swings e detecção de rompimentos para seus gráficos cTrader.
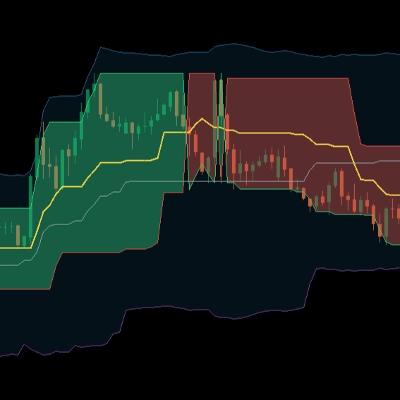
Este indicador detecta automaticamente picos e vales pivôs e constrói duas linhas de tendência adaptativas:
- Linha de tendência superior (resistência)
- Linha de tendência inferior (suporte)
As linhas são projetadas para frente usando um cálculo de inclinação configurável, ajudando você a visualizar a estrutura da tendência em tempo real e identificar momentos potenciais de rompimento com sinais claros de “B”.
✅ Principais Características
- Detecção automática de swings baseada em picos/vales pivôs
- Projeção dinâmica da linha de tendência com multiplicador de inclinação ajustável
- 3 métodos de cálculo de inclinação:
-
- ATR
- Desvio Padrão
- Aproximação de Regressão Linear
- Sinais de rompimento quando o preço rompe acima/abaixo das linhas de tendência
- Linhas estendidas opcionais para melhor visualização da tendência
- Indicador sobreposto limpo e leve (ideal para scalping, swing e trading de tendência)
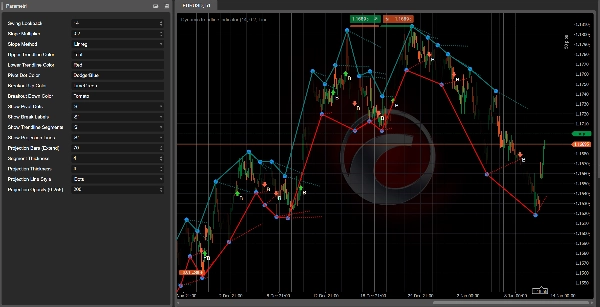
⚙️ Entradas / Configurações
- Período de retrocesso para detecção de swings
- Multiplicador de inclinação
- Método de cálculo da inclinação (ATR / Stdev / Linreg)
- Modo Backpaint (para visualização histórica)
- Visualização de linha estendida LIGADA/DESLIGADA
- Cores personalizadas para linhas de tendência de alta/baixa
🎯 Melhores Casos de Uso
- Identificação da direção e estrutura da tendência
- Negociação de rompimentos de suporte/resistência
- Confirmação de entradas com ação do preço
- Zonas de continuação e reversão de tendência
⚠️ Nota Importante (Transparência)
Por favor, note que já existe um cBot similar disponível na cTrader Store que segue uma lógica relacionada a este indicador.
Você pode conferi-lo aqui:
https://ctrader.com/it/products/2517?u=Labot
Este produto é um indicador projetado para análise gráfica e confirmação manual, enquanto o produto referenciado é um cBot (sistema de negociação automatizado).