
説明
Meravith Autoは、Meravithの手動取引システムの自動化バージョンです。
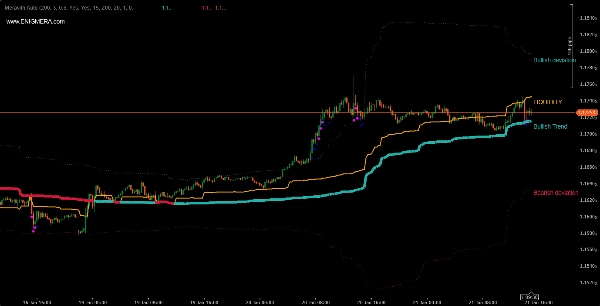
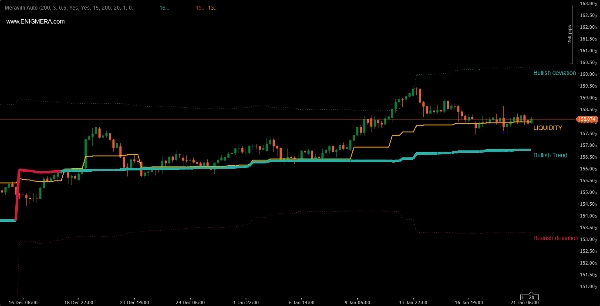
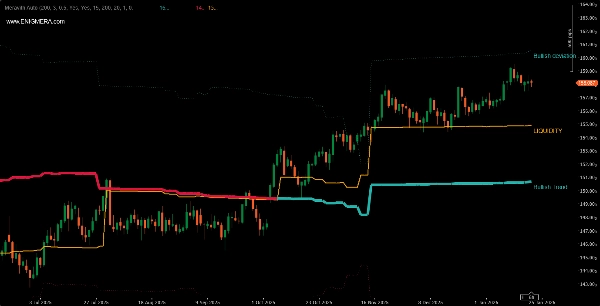
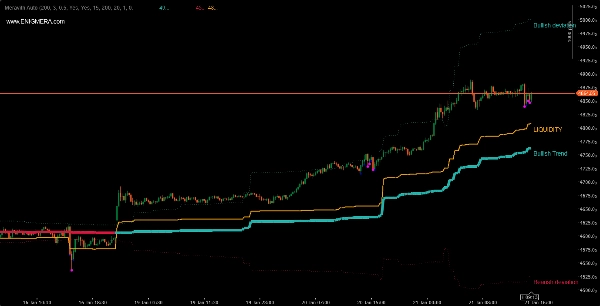
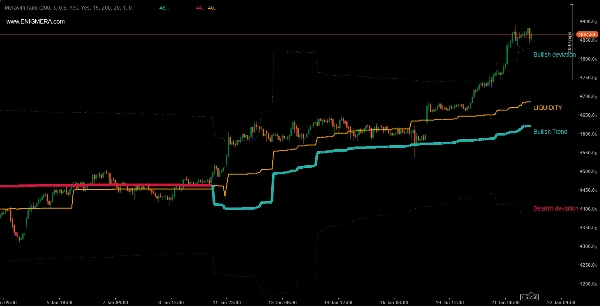
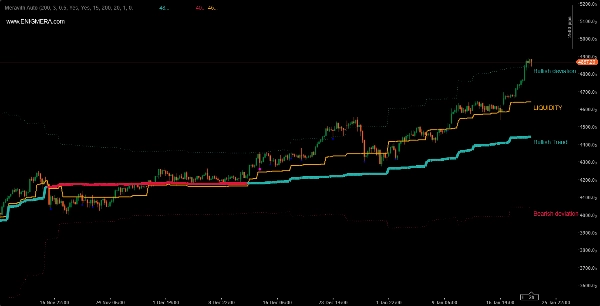
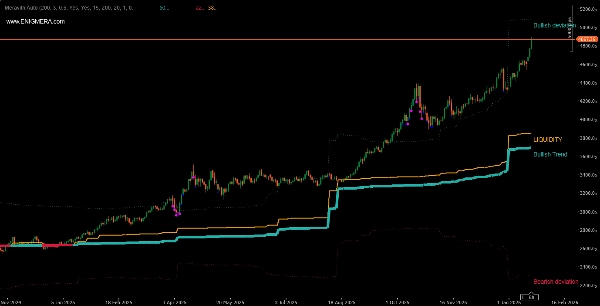
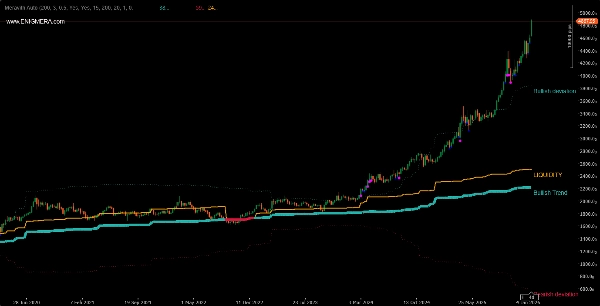
インジケーターは以下で構成されています:
- 色が変わるトレンドライン。強気の場合は緑、弱気の場合は赤です。これはトレンドのサポートラインです。
- 強気の出来高が弱気の出来高と等しい流動性ライン。
- 三重の強気偏差ライン。
- 三重の弱気偏差ライン。
- 高い出来高を示す紫と青の点。紫の点は平均出来高から2偏差以上の出来高を示し、青の点は2偏差の出来高を示します。
使い方は?
- 強気のトレンドラインとトレンドライン上の流動性は強気トレンドを意味します。市場が上昇すると予想し、ロングポジションを開きます。
- 弱気のトレンドラインとトレンドライン下の流動性は弱気トレンドを意味します。市場が下降すると予想し、ショートポジションを開きます。
他のインジケーターと自由に組み合わせてください。
どの通貨ペアや時間枠でも使用可能です。
ブローカーによって引用する出来高が異なるため、結果も異なる場合があります。
出来高が多いため、大手ブローカーの方が望ましいです。
自動バージョンと手動バージョンの違いは何ですか?
- 手動バージョンでは、高値と安値に基づくトレンド評価があります。それに応じて、市場の出来高枯渇レベルも提供されます。
- 自動バージョンでは、市場の異なるフェーズに応じて変化する期間があります。高ボラティリティ時は短く、低ボラティリティ時は長くなります。ここではトレンドではなく期間を分析するため、枯渇レベルはありません。これが偏差がある理由です。デフォルトでは三重偏差が表示されます。
概要
インジケーターのプロフィール
カスタマーレビュー
0.0
レビュー: 0
カスタマーレビュー
この商品にはまだレビューがありません。お使いになったことがある方は、ぜひレビューをお願いします。
ディスカッション
よくあるご質問
BTCUSD
Forex
Signal
Breakout
Indices
EURUSD
Commodities
GBPUSD
NZDUSD
Prop
Scalping
Crypto
Stocks
XAUUSD
NAS100
USDJPY
VWAP
cTrader Storeで入手可能な取引ボット、インジケーター、プラグインなどの商品は、第三者の開発者が提供するものであり、情報と技術の取得のみを目的としてご利用いただけます。cTrader Storeはブローカーではなく、投資助言や個人的な推奨を行うことも、将来のパフォーマンスを保証することもありません。


価格
登録日 24/10/2025