
Descrição
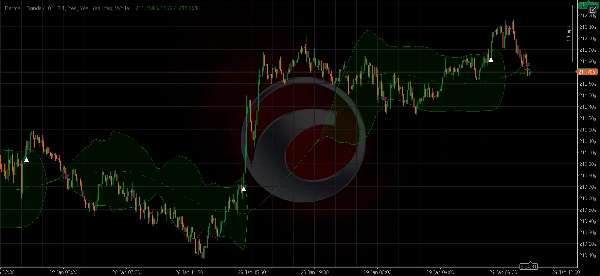
Bermaui Bands (BB) é uma ferramenta de análise técnica que ajuda a filtrar entre movimentos de preço em tendência e em faixa. A ideia por trás deste indicador pode ser explicada nos próximos passos -
- Calcular o Desvio Padrão como um oscilador que se move entre 0 e 100. Chamaremos isso de percentual de Desvio Bermaui (BD percent).
- Se o "BD percent" estiver próximo de zero, então a volatilidade está em seu extremo. Além disso, se o "BD percent" estiver próximo de 100, então a volatilidade é muito baixa.
- Alta volatilidade significa uma grande probabilidade de um mercado em tendência, enquanto baixa volatilidade significa mercado lateral ou em faixa.
- A Linha do Meio é uma Média Móvel Simples porque o Desvio Padrão é calculado dependendo da Média Móvel.
- Adicione o "BD percent" a uma média móvel simples com o mesmo número de barras no cálculo para obter a Banda Bermaui Superior.
- Subtraia o "BD percent" de uma média móvel simples com o mesmo número de barras no cálculo para obter as Bandas Bermaui Inferiores.
Resumo
Perfil do indicador
Avaliações de clientes
0.0
Avaliações: 0
Avaliações de clientes
Ainda não há avaliações para este produto. Já o experimentou? Seja o primeiro a contar a outras pessoas!
Conversa
Perguntas frequentes
Forex
Signal
Breakout
Indices
Commodities
Crypto
Stocks
Os produtos disponíveis através da cTrader Store, incluindo bots de negociação, indicadores e plugins, são fornecidos por programadores terceiros e são disponibilizados apenas para fins informativos e de acesso técnico. A cTrader Store não é um corretor e não fornece aconselhamento em matéria de investimento, recomendações pessoais ou qualquer garantia de desempenho no futuro.


![Logótipo de "Smart Money Concepts (SMC) [Iridio Capital]"](https://cdn.ctrader.com/image/webp/28b69fd1-ef54-4bed-9487-07e78e883be4_40934)


Preço
Desde 28/01/2026