
설명
기능
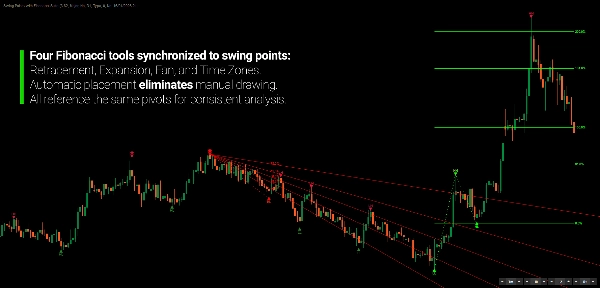
통합 스윙 감지에서 네 가지 피보나치 도구를 자동으로 그려 주어 주관성을 없애고 되돌림, 확장, 팬, 시간대 전반에 걸쳐 내부 일관성을 유지합니다.
수동 피보나치 그리기는 강력하지만 주관적입니다. 서로 다른 트레이더가 같은 차트에서 서로 다른 레벨을 그립니다. 자동화된 피보나치 도구는 일반적으로 하나의 분석 유형만 제공합니다 — 되돌림 또는 확장 또는 팬 — 여러 지표를 추가하거나 나머지를 수동으로 그려야 합니다.
이 지표는 네 가지 피보나치 도구를 하나의 시스템으로 통합합니다.
되돌림, 확장, 팬, 시간대는 동일한 스윙 감지 논리에서 자동으로 계산됩니다. 새로운 구조적 피벗이 형성되면 네 가지 도구 모두 동일한 스윙 포인트에 고정되어 실시간으로 업데이트됩니다. 수동 그리기 없음. 해석 차이 없음. 도구 간 전환 없음.
결과는 내부 일관성을 유지하는 포괄적인 피보나치 분석입니다.
자동 피보나치가 중요한 이유
피보나치 분석은 시장이 자연스럽게 되돌림과 확장을 하는 방식을 반영하기 때문에 널리 사용됩니다. 황금비율은 가격 구조에서 일관되게 나타나 피보나치 레벨을 지지, 저항 및 목표 투사에 유용한 기준점으로 만듭니다.
문제점
수동 피보나치 분석은 세 가지 실질적인 문제를 야기합니다:
- 주관성 — 서로 다른 트레이더가 서로 다른 스윙 포인트를 선택합니다
- 시간 소모 — 여러 시간대에 걸쳐 네 가지 도구를 그리려면 상당한 차트 작업이 필요합니다
- 불일치 — 스윙 A-B에서 되돌림, B-C에서 확장, C-D에서 팬을 그리면 분석이 단절됩니다
실제로 자동화된 피보나치 도구는 시간 문제를 해결하는 경우가 많지만 여전히 단절된 스윙 논리에 의존합니다. 되돌림은 자동으로 그리지만 확장과 팬 도구는 여전히 다른 스윙에서 수동으로 배치합니다.
해결책
이 지표는 네 가지 피보나치 도구를 단일 공유 스윙 모델에 적용합니다. 알고리즘이 스윙 포인트 A, B, C를 식별하면:
- 되돌림은 가장 최근 스윙 쌍에서 그려집니다
- 확장은 세 스윙 구조를 기반으로 투사됩니다
- 팬은 앵커 스윙에서 방사됩니다
- 시간대는 기본 스윙에서 앞으로의 간격을 표시합니다
각 도구는 동일한 구조적 피벗을 참조하여 모든 피보나치 뷰에서 전체 분석이 내부적으로 일관되도록 유지합니다.
핵심 개념
스윙 감지
이 지표는 회귀 방법을 사용하여 가격 움직임을 부드럽게 하고 구조적 피벗 포인트를 식별합니다. 단순 가격 극값이나 지표 교차와 달리 회귀는 순간적 변동성이 아닌 진정한 추세 변화를 반영하는 피벗을 생성합니다.
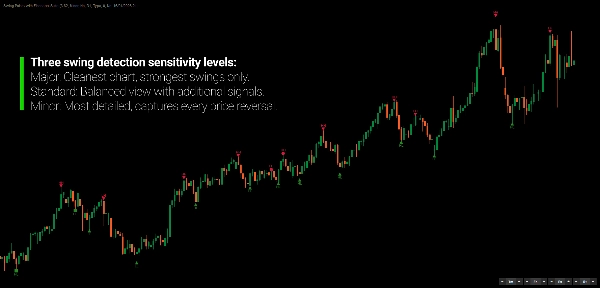
세 가지 감지 모드가 민감도를 제어합니다:
- 주요 — 가장 엄격한 필터로, 주요 시장 구조 피벗만 식별
- 표준 — 스윙 트레이딩 시간대에 적합한 균형 잡힌 접근법
- 부차적 — 더 큰 추세 내에서 반추세 스윙을 포함하여 상세 분석 가능
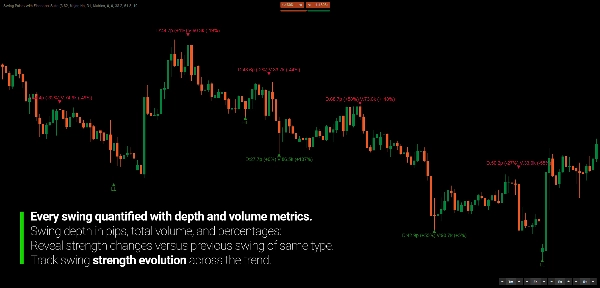
각 스윙은 (HH, HL, LH, LL)로 분류되며 선택적으로 깊이, 거래량, 기간, 효율성, 흡수, 확신 등의 지표가 라벨로 표시됩니다. 비교 백분율은 현재 스윙 강도가 동일 유형의 이전 스윙과 어떻게 비교되는지 보여줍니다.
피보나치 통합
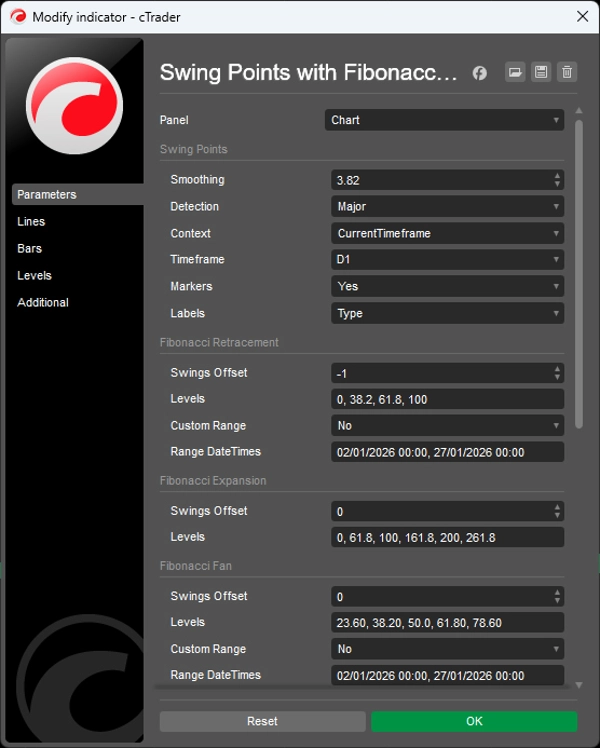
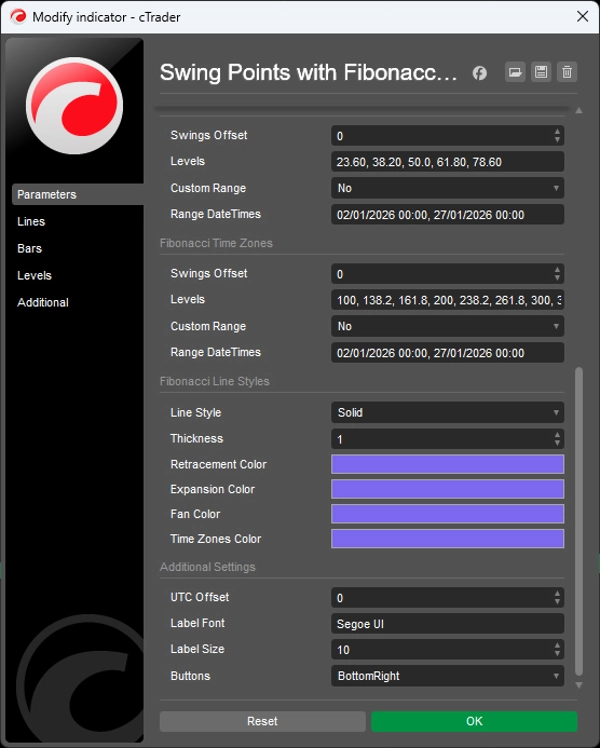
스윙이 감지되면 네 가지 피보나치 도구가 자동으로 그려집니다:
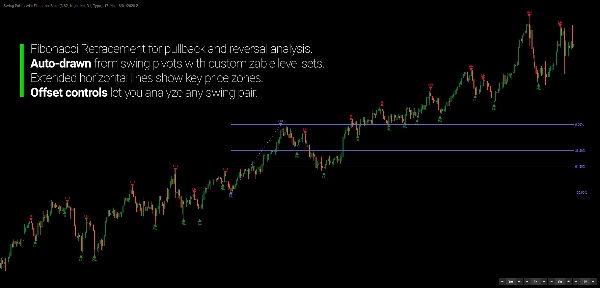
- 되돌림 — 가장 최근 스윙 쌍에서 수평 레벨
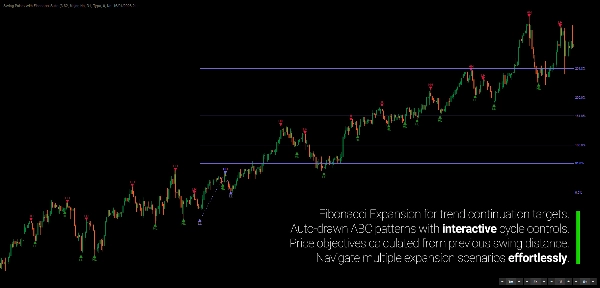
- 확장 — ABC 구조를 기반으로 한 가격 투사
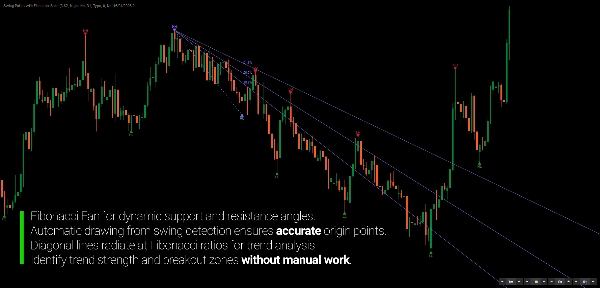
- 팬 — 앵커 포인트에서 대각선 추세 채널
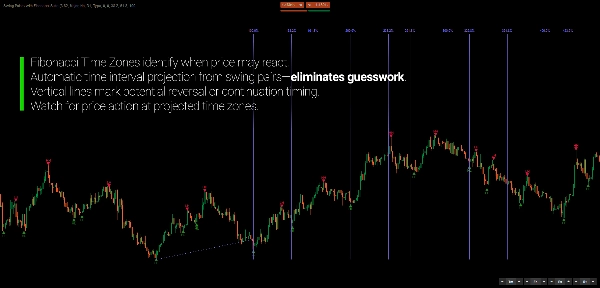
- 시간대 — 피보나치 간격을 사용한 수직 시간 투사
각 도구는 차트 내 버튼을 통해 독립적인 오프셋 제어가 가능합니다. 수동으로 다시 계산하거나 다시 그리지 않고도 각 분석 유형을 구동하는 스윙 쌍을 조정할 수 있습니다.
네 가지 도구 모두 사용자 지정 범위 모드로도 작동할 수 있으며, 이 모드에서는 감지된 스윙 대신 정확한 시작/종료 시간을 지정할 수 있어 특정 시장 이벤트나 세션 분석에 유용합니다.
다중 시간대 컨텍스트
이 지표는 더 높은 시간대에서 스윙을 감지하면서 현재 차트에 표시할 수 있습니다. 시간대 전환 없이 H1 차트에서 일간 스윙과 해당 피보나치 레벨을 볼 수 있습니다.
이는 실행 차트에서 더 높은 시간대의 구조적 컨텍스트를 제공하여 진입을 더 넓은 시장 방향과 일치시키는 데 도움을 줍니다.
주요 특징
스윙 감지
- 구조적 피벗 식별을 위한 회귀 필터링
- 세 가지 감지 모드: 주요(주요 구조), 표준(스윙 트레이딩), 부차적(상세 내부 스윙)
- 다중 시간대 기능 — 상위 TF에서 스윙 감지, 하위 TF 차트에 표시
- 스윙 분류 — HH/HL/LH/LL 라벨로 추세 구조 확인
- 세 가지 마커 유형 — 삼각형(확인됨), 원(상태 전용), 사각형(내부 스윙)
피보나치 도구
- 되돌림 — 9개의 구성 가능한 레벨(0%~100%)
- 확장 — 8개의 투사 레벨(0%~261.8%)
- 팬 — 5개의 대각선 채널(23.6%~78.6%)
- 시간대 — 9개의 시간 간격(100%~322.8%)
- 차트 내 UI 버튼을 통한 각 도구별 독립 오프셋 제어
- 사용자 지정 범위 모드 — 수동 날짜/시간 범위로 스윙 감지 무시
스윙 지표
- 기본 지표 — 깊이(핍), 거래량(틱 거래량), 기간(바)
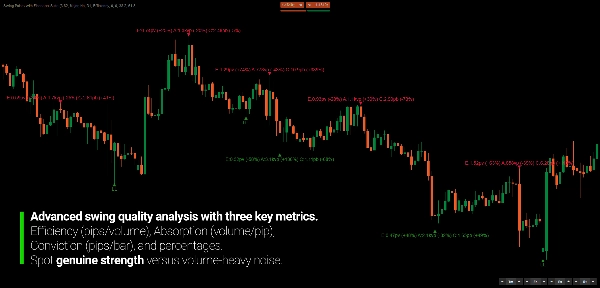
- 효율성 비율 — 효율성(거래량당 핍), 흡수(핍당 거래량), 확신(바당 핍)
- 비교 분석 — 동일 유형 이전 스윙 대비 백분율 변화
대상 사용자
이 지표는 피보나치를 독립 신호가 아닌 구조적 참조로 사용하는 트레이더를 위해 설계되었습니다.
피보나치 되돌림, 확장 또는 시간대를 정기적으로 그리는 경우 이 도구는 그 과정을 체계화합니다. 여러 스윙에 걸쳐 여러 도구를 수동으로 배치하는 대신, 이 지표는 동일한 구조적 참조점에서 네 가지 도구를 동시에 유지합니다.
여러 시간대를 분석하고 실행 차트에서 상위 시간대 구조를 보고자 하는 스윙 및 포지션 트레이더에게 적합합니다. 피보나치 중심 트레이더는 되돌림, 확장, 팬, 시간 분석이 단일 프레임워크로 통합되어 이점을 누릴 수 있습니다.
다중 시간대 분석가는 창 전환 없이 일간 또는 주간 스윙을 일중 차트에 표시할 수 있으며, 기술 분석가는 일반적으로 수동 계산이 필요한 스윙 지표(효율성, 흡수, 확신)에 접근할 수 있습니다.
이것은 진입 신호 시스템이 아닙니다. 피보나치를 시장 맥락에서 해석하기 위한 구조적 프레임워크로, 수동 차트 작업 부담을 줄이면서 피보나치 도구가 가치 있는 분석 깊이를 유지하도록 합니다.
차별점
여러 피보나치 도구를 적용하면 일반적으로 여러 스윙 해석을 다루게 됩니다. 통합된 구조적 참조가 없으면 되돌림, 확장, 팬, 시간 투사를 결합할 때 단절된 관점이 생기기 쉽습니다.
이 지표는 네 가지 도구를 단일 스윙 감지 알고리즘 아래 통합합니다. 각 피보나치 뷰는 동일한 구조적 피벗을 기반으로 구축되어 서로 다른 투사가 동일한 기본 시장 맥락을 반영하도록 보장합니다.
회귀 접근법은 단기 변동성을 필터링하면서 구조적 관련성을 유지합니다. 주요 모드는 주요 시장 피벗만 식별합니다. 부차적 모드는 더 큰 스윙 내 상세한 반추세 구조를 드러냅니다. 동일한 알고리즘, 다른 민감도.
다중 시간대 기능은 차트 전환 없이 실행 차트에 상위 시간대 컨텍스트를 제공합니다. H1 차트에서 일간 스윙과 완전한 피보나치 분석을 볼 수 있습니다 — 거래 시간대에서 구조적 컨텍스트.
독립 오프셋 제어를 통해 여러 스윙 구조를 동시에 분석할 수 있습니다. 가장 최근 스윙에서 되돌림을, 이전 설정에서 확장을 투사합니다. 모두 파라미터 패널 조정 없이 차트 내 버튼으로 제어됩니다.
---
시장 구조에서 피보나치 이해하기
피보나치 비율은 금융 시장을 포함한 자연 시스템 전반에 나타납니다. 되돌림이 38.2%, 50%, 61.8% 레벨 근처에서 멈추고 확장이 127.2% 또는 161.8% 투사에 도달하는 경향은 신비한 특성보다는 기본 시장 기하학을 반영합니다.
이 레벨들은 어느 정도 자기실현적입니다 — 충분한 트레이더가 이를 주시하여 주문 흐름에 영향을 미치지만, 시간대와 상품 전반에 걸친 지속성은 더 구조적인 무언가를 시사합니다.
실용적인 관점에서 피보나치 레벨은 객관적인 기준점을 제공합니다. 되돌림에서 지지가 어디에 형성될지 추측하는 대신, 피보나치 되돌림은 모니터링할 구체적인 가격 구역을 제공합니다.
문제는 피보나치가 작동하느냐가 아니라 — 어떻게 일관되게 적용하느냐입니다. 수동 분석은 변동성을 도입합니다: 어느 스윙에서 측정합니까? 꼬리(윅)나 종가를 사용합니까? 여러 스윙 쌍에서 겹치는 되돌림은 어떻게 처리합니까?
체계적인 적용은 이러한 질문을 제거합니다. 알고리즘은 매번 동일한 기준으로 스윙을 선택합니다. 네 가지 도구 모두 동일한 피벗을 참조합니다. 분석은 다양한 시장 조건에서 복제 가능하고 비교 가능합니다.
이는 재량을 없애지 않습니다 — 여전히 어떤 스윙 오프셋을 분석할지, 어떤 레벨이 설정에 중요한지, 도구 간 합류를 어떻게 해석할지 결정합니다. 그러나 그 재량을 위한 일관된 기반을 마련합니다.
---
거래에는 위험이 따릅니다. 이 지표는 기술적 분석 도구이며 항상 적절한 위험 관리를 적용해야 합니다.


