
설명
기능
피보나치 채널은 대부분의 피보나치 도구가 무시하는 문제를 해결합니다: 어디에 앵커를 두느냐가 어떤 레벨을 그리느냐보다 더 중요합니다.
대부분의 트레이더는 피보나치 되돌림을 수동으로 적용합니다 — 스윙 고점과 저점을 선택하고 도구를 그리며 구조가 유지되길 바랍니다. 결과는 가격이 어느 한 극단을 넘어서는 순간 무의미해지는 정적인 스냅샷입니다.
이 지표는 접근 방식을 바꿉니다.
고정된 스윙에 고정하는 대신, 피보나치 채널은 사용자가 선택한 지점에 앵커를 두고 그 앵커부터 현재 바까지의 최고점과 최저점을 지속적으로 추적합니다. 범위가 확장됨에 따라 채널도 함께 확장됩니다. 피보나치 레벨은 항상 실제로 형성된 범위를 반영하며 — 과거의 추측이 아닙니다.
채널은 시장과 함께 성장합니다. 레벨은 의미를 유지합니다.
방향은 자동으로 추적됩니다. 강세 상황에서는 레벨이 위에서 아래로 측정되고, 약세 상황에서는 아래에서 위로 측정됩니다. 수동 조정이 필요 없으며 — 지표가 구조를 읽고 그에 맞게 방향을 정합니다.
왜 앵커 기반 피보나치인가?
문제점
표준 피보나치 도구는 두 개의 고정된 지점 사이에 그려집니다. 가격이 어느 한 극단을 넘는 순간 도구는 더 이상 유효하지 않으며 — 수동으로 다시 그려야 합니다. 이는 지속적인 조정 주기를 만들고, 피보나치 맵은 실제로 형성된 전체 범위를 정확히 반영하지 못합니다.
더 깊은 문제도 있습니다: 앵커를 어디에 두느냐가 모든 것을 정의합니다. 임의의 위치 선정은 임의의 레벨을 만듭니다.
해결책
피보나치 채널은 앵커 지점에 대한 의도적인 제어를 제공하며 — 그 이후 모든 것을 자동으로 처리합니다. 구조적으로 의미 있는 바(추세 시작, 주요 반전, 세션 시작)에 앵커를 두면, 지표가 그 지점부터 전체 범위를 앞으로 구축합니다. 시장이 만드는 모든 새로운 고점이나 저점이 채널의 일부가 됩니다. 피보나치 레벨은 실시간으로 업데이트됩니다.
앵커는 드래그 가능합니다. 차트에서 이동하면 전체 채널이 즉시 다시 그려집니다.
왜 여러 모드가 필요한가?
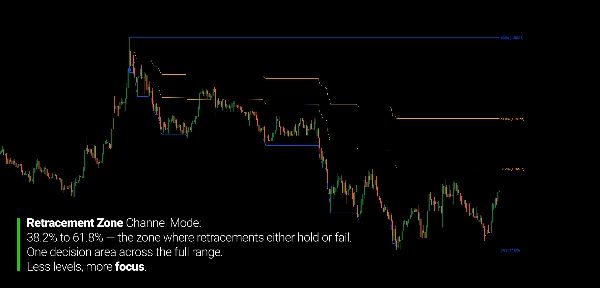
전체 피보나치 그리드가 항상 필요한 것은 아닙니다. 때로는 38.2%와 61.8% 사이의 되돌림 구간에 집중할 때가 있습니다. 때로는 범위의 상단 또는 하단 절반에서 구조를 분리하고 싶을 때도 있습니다.
일곱 가지 구별된 채널 모드는 상황에 맞는 정확한 세부 수준을 적용할 수 있게 하며 — 사용하지 않는 레벨로 차트를 복잡하게 만들지 않습니다.
핵심 개념
지표는 앵커에서 단일 전방 패스로 작동합니다:
- 사용자가 선택한 바에 앵커 아이콘을 둡니다
- 그 바부터 앞으로 지표가 최고점과 최저점을 추적합니다
- 채널 경계선(상단선, 하단선)이 이 확장되는 범위를 반영합니다
- 피보나치 레벨은 범위 내에서 계산되며 추세 방향에 따라 정렬됩니다
- 앵커를 이동하면 — 채널이 즉시 재계산됩니다
추세 방향은 현재 종가와 앵커 바의 시가를 비교하여 결정됩니다. 강세: 레벨은 상단에서 하단으로 측정합니다. 약세: 레벨은 하단에서 상단으로 측정합니다. 시장의 방향성 컨텍스트가 바뀌면 채널이 자동으로 방향을 재조정합니다.
앵커는 바의 시가 시간과 가격에 스냅되어 깔끔하고 재현 가능한 위치를 제공합니다.
채널 모드
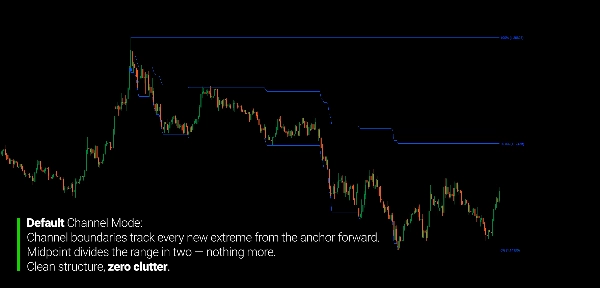
기본 상단선, 하단선, 중간선만 표시. 내부 레벨 없이 깔끔한 범위 경계 보기.
되돌림 구간 61.8%와 38.2% 레벨 추가 — 전체 범위 내 핵심 되돌림 구간. 움직임 내 주요 되돌림 영역 식별에 최적.
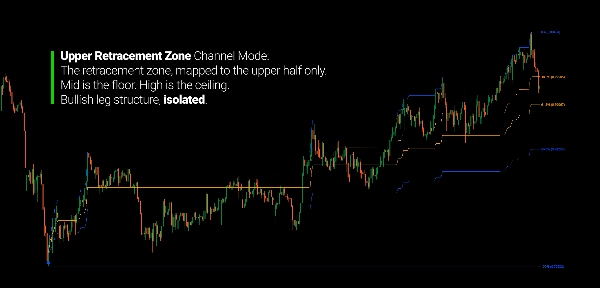
상단 되돌림 구간 채널 상단 절반(중간과 상단 사이)에 매핑된 되돌림 구간. 상승 구간 내 되돌림 구조 분리에 유용.
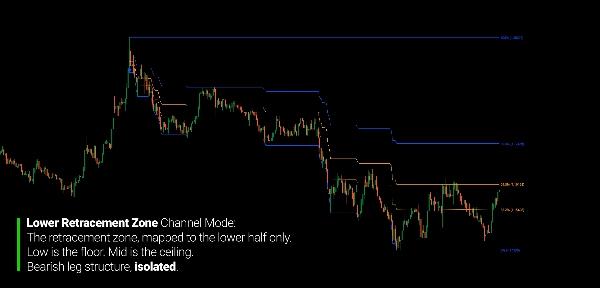
하단 되돌림 구간 채널 하단 절반(하단과 중간 사이)에 매핑된 되돌림 구간. 하락 구간에 동일한 논리 적용.
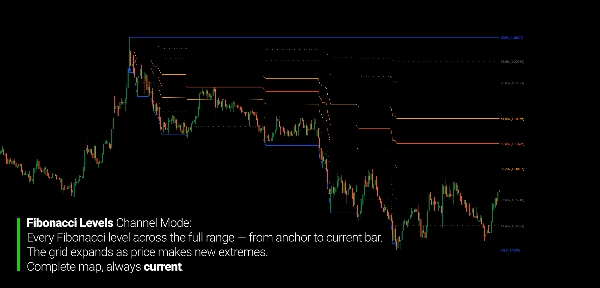
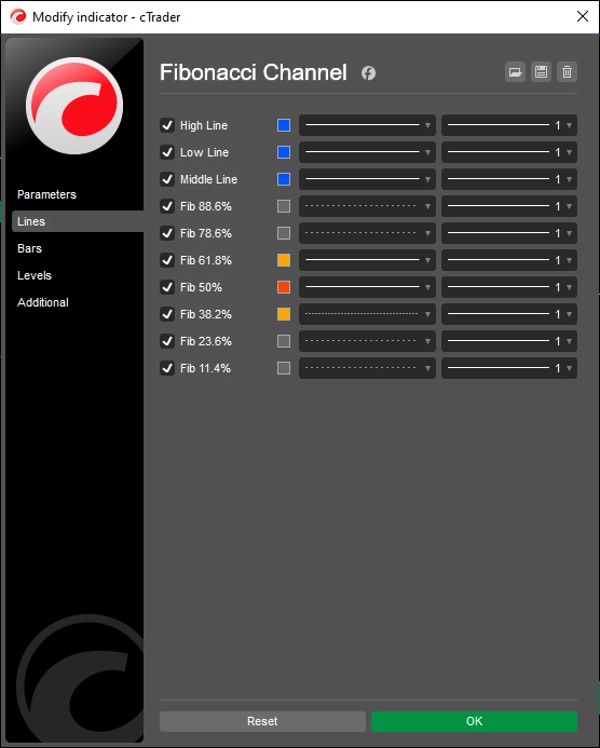
피보나치 레벨 전체 범위에 걸친 완전한 피보나치 그리드: 88.6%, 78.6%, 61.8%, 50%, 38.2%, 23.6%, 11.4%. 완전한 레벨 맵을 원하는 트레이더용.
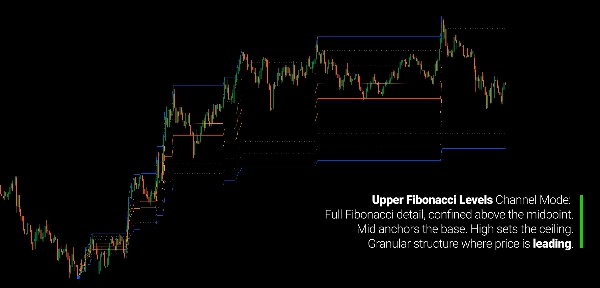
상단 피보나치 레벨 채널 상단 절반에만 적용된 완전한 피보나치 그리드.
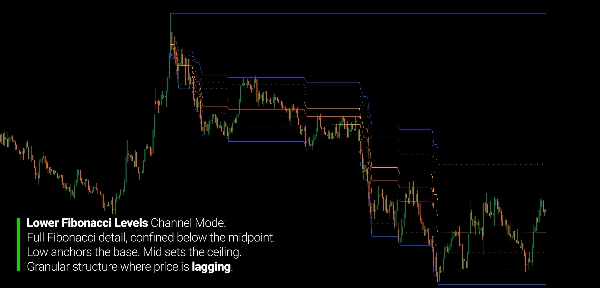
하단 피보나치 레벨 채널 하단 절반에만 적용된 완전한 피보나치 그리드.
차트 읽기
- 상단선: 채널의 상단 경계 (앵커부터의 최고점)
- 하단선: 채널의 하단 경계 (앵커부터의 최저점)
- 중간선: 전체 범위의 중간 지점
- 61.8% / 38.2%: 핵심 되돌림 구간 (주황색 선)
- 50%: 중간 되돌림 레벨 (빨간-주황색)
- 78.6% / 88.6% / 23.6% / 11.4%: 확장된 피보나치 레벨 (회색 점선)
- 앵커 아이콘: 드래그 가능 — 채널 시작 위치를 재정의하기 위해 이동
방향 참조:
- 강세 컨텍스트 → 레벨이 위에서 아래로 정렬됨 (상단 = 0%, 하단 = 100%)
- 약세 컨텍스트 → 레벨이 아래에서 위로 정렬됨 (하단 = 0%, 상단 = 100%)
- 최신 종가가 앵커 시가를 넘을 때 방향이 자동으로 업데이트됨
매개변수
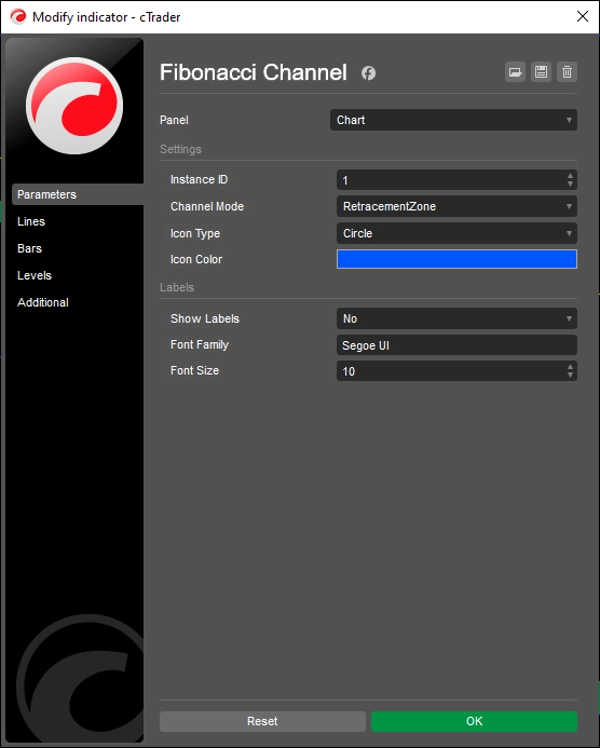
설정
- 인스턴스 ID — 동일 차트에서 여러 독립 채널 지원
- 채널 모드 — 표시할 레벨 선택 (7가지 모드)
- 아이콘 유형 — 드래그 가능한 앵커의 시각적 스타일
- 아이콘 색상 — 앵커 마커의 색상
라벨
- 라벨 표시 — 각 레벨의 가격 라벨 토글
- 폰트 패밀리 — 라벨 서체
- 폰트 크기 — 라벨 크기 (6–32)
대상 사용자
이 지표는 피보나치 분석을 기계적 신호 도구가 아닌 구조적 참조로 사용하는 트레이더를 위한 것입니다.
가격이 새로운 극단을 만들 때마다 피보나치 도구를 다시 그리거나 — 정적인 되돌림이 처음 몇 바 이후 시장을 반영하지 못하는 것을 경험했다면 — 이 지표는 바로 그 문제를 해결하기 위해 만들어졌습니다.
이 지표는 스윙 및 포지션 트레이더에게 적합하며, 가격이 발전함에 따라 유효한 피보나치 맵을 원하고, 범위 및 구조 트레이더에게도 적합하며, 채널 경계와 되돌림 구간을 진입 또는 청산 참조로 사용하며, 멀티 인스턴스 사용자가 동일한 종목에서 여러 독립 채널을 동시에 추적하고자 할 때 유용합니다.
드래그 가능한 앵커 덕분에 실시간 사용에 실용적입니다: 구조적으로 중요한 지점에 채널 시작을 설정하고 지표가 그 지점부터 맵을 유지하게 하세요. 다시 그리기나 수동 업데이트가 필요 없습니다.
이것은 신호 생성기가 아닙니다. 이것은 구조적 참조 프레임워크로, 피보나치 레벨을 진입 트리거가 아닌 컨텍스트로 사용하는 트레이더를 위한 것입니다.
차별점
대부분의 피보나치 도구는 정적입니다: 두 개의 고정 지점, 하나의 고정 맵. 이 지표는 동적입니다 — 가격이 발전함에 따라 범위가 확장되고, 레벨은 항상 선택한 앵커부터 현재 바까지의 실제 범위를 반영합니다.
대부분의 피보나치 구현은 수동 방향 설정이 필요합니다. 이 지표는 강세와 약세 컨텍스트를 자동으로 읽고 모든 레벨을 그에 맞게 정렬합니다 — 트레이더가 매개변수를 변경할 필요 없이.
대부분의 채널 도구는 하나의 레이아웃만 제공합니다. 이 지표는 깔끔한 경계 보기부터 전체 범위 또는 절반에 독립적으로 적용된 완전한 피보나치 그리드까지 일곱 가지 구별된 모드를 제공합니다. 차트는 분석 중인 컨텍스트에 필요한 정확한 세부 수준을 보여줍니다.
여러 인스턴스가 독립적인 앵커와 함께 동시에 실행될 수 있으며 — 각각이 서로 간섭 없이 다른 구조적 구간을 추적합니다.
---
피보나치 구조 이해하기
피보나치 비율은 예측적이지 않습니다. 이들은 가격 범위 내 비례 관계를 설명하며 — 트레이더들이 수십 년간 시장과 시간대 전반에 걸쳐 반복되는 것을 관찰한 관계입니다. 이것이 시장의 수학적 특성을 반영하는지 아니면 잘 알려진 레벨 주변의 집단 행동일 뿐인지는 미지수입니다. 실용적 사용에 중요한 것은 더 간단합니다.
피보나치 채널은 움직임의 범위를 정의하고 이를 비례적으로 의미 있는 구간으로 나눕니다. 트레이더들은 이 구간을 사용해 되돌림이 얕은지 깊은지, 되돌림이 유지되는지 실패하는지, 가격이 역사적으로 중요한 구조 영역에 접근하는지를 평가합니다.
앵커 기반 접근법의 가치는 분석을 특정 구조적 사건에 기반하도록 유지한다는 점입니다. 채널은 임의의 지점에서 시작하지 않고 — 관련 움직임이 시작되었다고 판단한 지점에서 시작합니다. 그 결정은 차트를 읽는 당신의 몫입니다. 지표의 역할은 그 지점부터 정확하게 맵을 유지하여 측정하는 구조가 온전한 한 레벨이 유효하게 유지되도록 하는 것입니다.
---
트레이딩은 위험을 수반합니다. 이 지표는 기술적 분석 도구이며 — 항상 적절한 위험 관리를 적용하세요.
요약
고객 리뷰
5 | 100 % | |
4 | 0 % | |
3 | 0 % | |
2 | 0 % | |
1 | 0 % |


!["[Stellar Strategies] Inside Bar with Signals" 로고](https://cdn.ctrader.com/image/webp/1d9e8bfa-3b2c-4440-bb37-5856902008a7_30683)


