
คำอธิบาย
สิ่งที่มันทำ
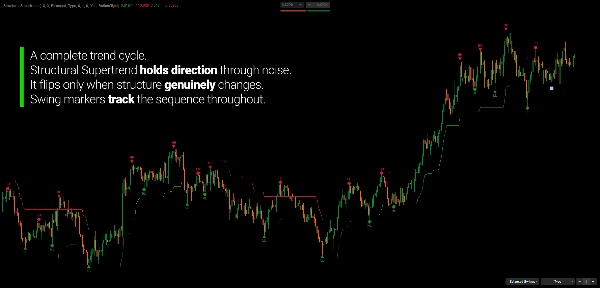
Structural Supertrend แก้ไขข้อจำกัดพื้นฐานของ Supertrend แบบคลาสสิก: มันเปลี่ยนทิศทางทันทีที่ราคาปิดเกินแถบของมัน
ในแนวโน้มที่ชัดเจน วิธีนี้ใช้ได้ดี ในสภาวะที่ผันผวนหรือแกว่งไปมา เทียนที่รุนแรงเพียงแท่งเดียวสามารถทำให้เกิดการเปลี่ยนทิศทาง — แม้ว่าแนวโน้มโดยรวมจะยังคงอยู่ในโครงสร้างที่มั่นคง ผลลัพธ์คือการสวิงกลับอย่างรวดเร็ว การออกจากตำแหน่งก่อนเวลา และการเข้าซื้อซ้ำในราคาที่แย่กว่า
ตัวบ่งชี้นี้ถูกสร้างขึ้นบนสมมติฐานที่แตกต่าง
การเปลี่ยนทิศทางเกิดขึ้นก็ต่อเมื่อราคายืนยันการเปลี่ยนแปลงโครงสร้างที่แท้จริง — ไม่ใช่แค่การปิดชั่วคราวเกินเกณฑ์ ผลลัพธ์คือการกลับตัวผิดพลาดน้อยลงและสอดคล้องกับวิธีที่แนวโน้มพัฒนาอย่างแท้จริงมากขึ้น
Supertrend กลายเป็นโครงสร้าง สัญญาณกลายเป็นมีความหมาย
ทำไมต้อง Structural Supertrend?
ปัญหา
Supertrend แบบดั้งเดิมถือว่าการปิดทุกครั้งที่เกินแถบเป็นการกลับตัว ซึ่งเป็นเจตนา — ทำให้ตัวบ่งชี้ตอบสนองได้อย่างรวดเร็วตามการออกแบบ แต่การตอบสนองนี้มีค่าใช้จ่าย
ในช่วงการรวมตัว ราคามักจะปิดเกินแถบหนึ่งแล้วกลับตัวทันที แต่ละครั้งสร้างสัญญาณเปลี่ยนทิศทาง แต่ละการเปลี่ยนทิศทางเป็นการตัดสินใจซื้อขายที่เป็นไปได้ และแต่ละการเปลี่ยนทิศทางเป็นการออกจากตำแหน่งที่ไม่จำเป็นต้องออก
เทรดเดอร์ที่ใช้ Supertrend มานานจะรู้สึกหงุดหงิดกับเรื่องนี้ดี
ทางแก้
Structural Supertrend ขยายโมเดลเดิมเพื่อแยกแยะระหว่างการปิดที่เกิดจากความผันผวนกับการเปลี่ยนทิศทางที่แท้จริง มันกรองเสียงรบกวนโดยต้องการการยืนยันโครงสร้างก่อนเปลี่ยนทิศทางแนวโน้ม
การเปลี่ยนทิศทางน้อยลง สอดคล้องกับแนวโน้มดีกว่า ตอบสนองน้อยลงต่อเทียนแต่ละแท่ง
ทำไมต้องเก็บทั้งสองแบบ?
Supertrend แบบดั้งเดิมยังคงแสดงบนชาร์ต — แต่เฉพาะในที่ที่แตกต่างจาก Structural เท่านั้น การออกแบบนี้เป็นเจตนา
- Structural ติดตามทิศทางแนวโน้มหลัก
- Original เผยพฤติกรรมแรงกระตุ้นและการแก้ไขภายในแนวโน้มนั้น
เมื่อทั้งสองเห็นด้วย: ความเชื่อมั่นในทิศทางสูง เมื่อพวกเขาแตกต่าง: การเคลื่อนไหวมีแนวโน้มเป็นการแก้ไข ไม่ใช่การกลับตัวที่แท้จริง มุมมองสองชั้นนี้ให้บริบทที่ไม่มีเส้นใดเส้นหนึ่งให้ได้เพียงลำพัง
การตรวจจับสวิงแบบบูรณาการ
Structural Supertrend รวมการตรวจจับสวิงและกรอบ S/R แบบเต็ม — ไม่ใช่ฟีเจอร์รอง แต่เป็นการขยายโดยตรงของการวิเคราะห์โครงสร้าง
สวิงถูกระบุผ่านกระบวนการคัดเลือกโดยโครงสร้างก่อน: แต่ละตัวอย่างถูกประเมินตามการเคลื่อนที่ การยืนยันปริมาณ และระยะทางสัมพันธ์กับ ATR ก่อนที่จะยอมรับ วิธีนี้ทำให้แผนที่สวิงมุ่งเน้นไปที่จุดเปลี่ยนที่มีความหมายแทนที่จะเป็นจุดสูงสุดท้องถิ่นทุกจุด
สามโหมดการตรวจจับ
- เล็กน้อย — ความไวเพิ่มขึ้น จับสวิงภายในแนวโน้ม
- สมดุล — ความละเอียดกรองแล้ว เหมาะสำหรับกรณีใช้งานส่วนใหญ่
- ใหญ่ — จุดหมุนโครงสร้างที่แข็งแกร่งที่สุดเท่านั้น ยืนยันโดยเกณฑ์ที่กว้างขึ้น
การจัดประเภทความแข็งแกร่งของสวิง
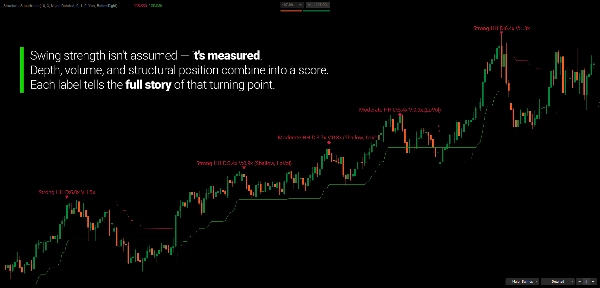
แต่ละสวิงที่ได้รับการยืนยันจะถูกให้คะแนนโดยความลึก ปริมาณ และตำแหน่งโครงสร้างสัมพันธ์กับสวิงก่อนหน้าของประเภทเดียวกัน ความแข็งแกร่งถูกจัดประเภทแบบไดนามิกโดยใช้การจัดอันดับเปอร์เซ็นไทล์จากประวัติสวิงล่าสุด — ไม่ใช่เกณฑ์คงที่ เครื่องหมายภาพสะท้อนการจัดประเภท: สามเหลี่ยมสำหรับแข็งแกร่ง เพชรสำหรับปานกลาง วงกลมสำหรับอ่อนแอ
โซน S/R พร้อมการติดตามขั้ว
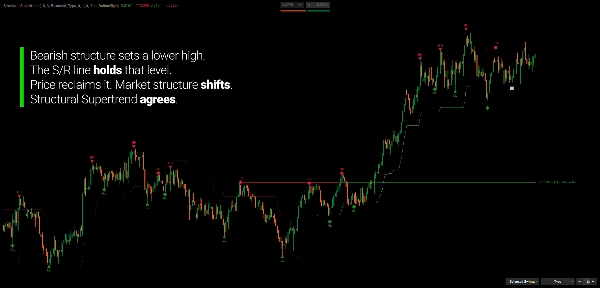
สวิงที่ได้รับการยืนยันกลายเป็นระดับ S/R ที่ใช้งานซึ่งติดตามประวัติการโต้ตอบของตนเอง เมื่อราคากลับมาที่ระดับ ตัวบ่งชี้จะบันทึกว่าการสัมผัสเป็นการปฏิเสธไส้เทียนหรือการเบรกของตัวแท่ง เมื่อระดับถูกกวาดและปิดเกินระดับนั้น ขั้วจะเปลี่ยน — ความต้านทานเดิมกลายเป็นแนวรับ และในทางกลับกัน หากถูกกวาดอีกครั้ง โซนนั้นจะถูกยกเลิก
ป้ายอายุแสดงเวลาที่แต่ละระดับใช้งานและจำนวนครั้งที่ถูกทดสอบ
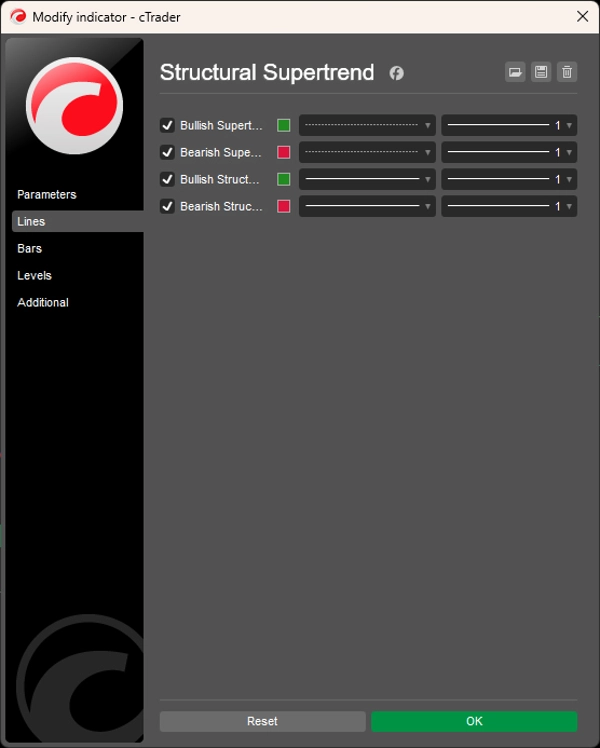
การอ่านชาร์ต
- เส้นโครงสร้างสีเขียว: แนวโน้มโครงสร้างขาขึ้น (แนวรับแบบไดนามิก)
- เส้นโครงสร้างสีแดง: แนวโน้มโครงสร้างขาลง (แนวต้านแบบไดนามิก)
- เส้นประ: Supertrend แบบดั้งเดิม — เห็นได้เฉพาะที่แตกต่างจาก Structural
- เส้น S/R: ระดับที่ใช้งานพร้อมสถานะขั้วและอายุ
การตรวจสอบความสอดคล้องของแนวโน้ม:
- โครงสร้าง + แบบดั้งเดิม เห็นด้วย → การเคลื่อนไหวที่มีความเชื่อมั่นสูง
- โครงสร้าง + แบบดั้งเดิม แตกต่าง → มีแนวโน้มเป็นช่วงแก้ไขหรือช่วงเปลี่ยนผ่าน
เหมาะสำหรับใคร
ตัวบ่งชี้นี้สำหรับเทรดเดอร์ที่ต้องการอ่านทิศทางแนวโน้มและโครงสร้างตลาดจากกรอบงานเดียวที่สอดคล้องกัน
ถ้าคุณเคยใช้ Supertrend แบบคลาสสิกและพบว่ามันตอบสนองเกินไป — เปลี่ยนทิศทางบ่อยในช่วงที่ตลาดแกว่ง — Structural Supertrend ถูกสร้างขึ้นมาเพื่อแก้ไขปัญหานั้นโดยเฉพาะ
มันเหมาะสำหรับ เทรดเดอร์แนวโน้มและสวิง ที่ต้องการการอ่านทิศทางที่ชัดเจนขึ้นโดยไม่มีการกลับตัวผิดพลาดบ่อย ๆ, เทรดเดอร์ที่เน้นโครงสร้าง ที่ติดตามลำดับสวิงเพื่อยืนยันสุขภาพของแนวโน้ม และ เทรดเดอร์ที่ใช้ดุลยพินิจ ที่ใช้ระดับ S/R เป็นบริบทสำหรับการเข้าออกและการจัดการตำแหน่ง
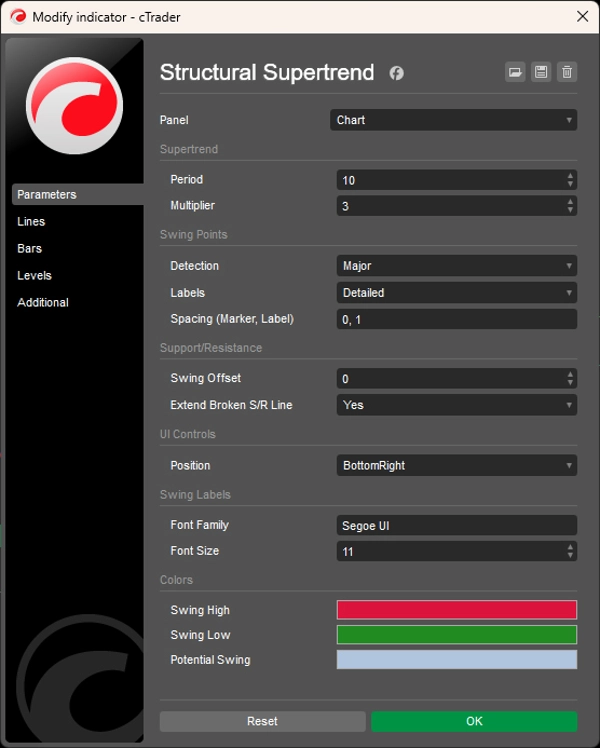
การควบคุม UI ที่ติดตั้งมาทำให้ใช้งานได้จริงแบบเรียลไทม์: สลับโหมดการตรวจจับ ปรับการอ้างอิง S/R และสลับรายละเอียดป้ายบนชาร์ตโดยตรง — ไม่ต้องเปิดแผงตั้งค่า
นี่ไม่ใช่เครื่องมือสร้างสัญญาณ แต่มันคือ กรอบการวิเคราะห์โครงสร้าง สำหรับเทรดเดอร์ที่ต้องการเข้าใจว่าตลาดอยู่ที่ไหน ไม่ใช่แค่สิ่งที่มันกำลังทำในตอนนี้
สิ่งที่ทำให้มันแตกต่าง
การใช้งาน Supertrend ส่วนใหญ่ถือว่าการปิดทุกครั้งที่เกินแถบเป็นการดำเนินการได้ ตัวนี้ถือเป็นแค่ตัวอย่าง — และต้องการหลักฐานโครงสร้างก่อนที่จะยืนยันการเปลี่ยนทิศทาง
เครื่องตรวจจับสวิงส่วนใหญ่ระบุจุดสูงและต่ำท้องถิ่นโดยไม่มีเกณฑ์การประเมิน ตัวนี้คัดเลือกแต่ละสวิงโดยพิจารณาจากการเคลื่อนที่ ปริมาณ และตำแหน่งโครงสร้าง — และให้คะแนนความแข็งแกร่งแบบไดนามิกเทียบกับประวัติสวิงล่าสุด
เครื่องมือ S/R ส่วนใหญ่ลากเส้นแล้วปล่อยไว้ ตัวนี้ติดตามประวัติการโต้ตอบ แจ้งเตือนการเปลี่ยนขั้ว และพัฒนาต่อเนื่องเมื่อราคากลับมาที่แต่ละระดับ
ผลลัพธ์: เครื่องมือแนวโน้มและโครงสร้างที่ยังคงเกี่ยวข้องนานขึ้น ตอบสนองน้อยลงต่อเสียงรบกวน และสร้างภาพรวมสภาพตลาดที่สมบูรณ์ขึ้นเมื่อเวลาผ่านไป
---
ความเข้าใจเกี่ยวกับการวิเคราะห์โครงสร้าง
โครงสร้างตลาดไม่ใช่การหาสวิงที่ "ถูกต้อง" หรือทิศทางแนวโน้มที่ "ถูกต้อง" แต่มันคือการรักษาภาพวัตถุประสงค์ของวิธีที่ลำดับราคากำลังพัฒนา — และว่าลำดับนั้นยังคงสอดคล้องหรือเริ่มเสื่อมสภาพ
แนวโน้มถูกกำหนดไม่ใช่โดยการเคลื่อนไหวครั้งเดียว แต่โดยชุดของความสัมพันธ์: จุดสูงและต่ำที่สูงขึ้นในแนวโน้มขาขึ้น จุดสูงและต่ำที่ต่ำลงในแนวโน้มขาลง สวิงใหม่แต่ละครั้งยืนยันหรือท้าทายลำดับที่มีอยู่ เมื่อการยืนยันดำเนินต่อไป โครงสร้างยังคงอยู่ เมื่อมันแตก โครงสร้างกำลังเปลี่ยนแปลง
สิ่งที่ทำให้การวิเคราะห์โครงสร้างมีประโยชน์ไม่ใช่การทำนายว่าราคาจะไปที่ไหน แต่เป็นการบรรยายว่าราคากำลังอยู่ที่ไหนในลำดับของมัน ความแตกต่างนี้สำคัญ การทำนายต้องการสมมติฐานเกี่ยวกับอนาคต การสังเกตโครงสร้างต้องการแค่การอ่านที่ถูกต้องของสิ่งที่เกิดขึ้นแล้ว
ตัวบ่งชี้ที่สร้างบนตรรกะโครงสร้างถูกออกแบบมาเพื่อสนับสนุนการสังเกตนั้น — เพื่อทำให้ลำดับมองเห็นและติดตามได้โดยไม่ต้องมีการตีความเชิงอัตวิสัย เป้าหมายคือความชัดเจนเกี่ยวกับสภาพตลาดปัจจุบัน ไม่ใช่ความแน่นอนเกี่ยวกับทิศทางราคาที่จะเกิดขึ้น
---
การเทรดมีความเสี่ยง ตัวบ่งชี้นี้เป็นเครื่องมือวิเคราะห์ทางเทคนิค — โปรดใช้การจัดการความเสี่ยงอย่างเหมาะสมเสมอ
สรุป
รีวิวจากลูกค้า
5 | 67 % | |
4 | 33 % | |
3 | 0 % | |
2 | 0 % | |
1 | 0 % |


