

Descrição
A IDEIA
Um Canal Donchian que adiciona contexto de intervalo de timeframe superior em vez de visualizar cada rompimento isoladamente.
O PROBLEMA
Um Canal Donchian padrão informa quando o preço atinge um extremo recente.
Mas um rompimento não acontece isoladamente.
Um rompimento no M15 pode ser significativo — ou pode simplesmente ser o preço se movendo dentro de um intervalo Diário ou Semanal muito maior.
O mesmo rompimento pode, portanto, ter contextos muito diferentes dependendo de onde ocorre dentro do intervalo de timeframe superior.
O canal mostra o rompimento. Mas o canal sozinho não mostra onde esse rompimento está dentro do intervalo maior.
O CONCEITO PRINCIPAL: O CANAL MOSTRA O MOVIMENTO. O TIMEFRAME SUPERIOR MOSTRA ONDE ELE ACONTECE.
Um rompimento não é apenas um evento.
Ele também tem uma localização.
Dois rompimentos podem parecer idênticos no timeframe de execução enquanto ocorrem em posições muito diferentes dentro do intervalo de timeframe superior.
Um pode ocorrer perto do meio do intervalo maior.
Outro pode ocorrer diretamente dentro do seu limite superior.
A ação do preço pode parecer a mesma.
O contexto não é.
Este indicador torna esse contexto visível ao colocar o intervalo de timeframe superior previamente concluído diretamente no seu gráfico atual.
Em vez de perguntar apenas:
"O preço rompeu o canal?"
você também pode perguntar:
"Onde o rompimento aconteceu?"
O QUE ELE FAZ
Canal Donchian com Contexto de Timeframe combina duas camadas de informação em um único gráfico:
1. Donchian do Timeframe Atual
O Canal Donchian padrão acompanha a máxima, mínima e ponto médio recentes do mercado atual.
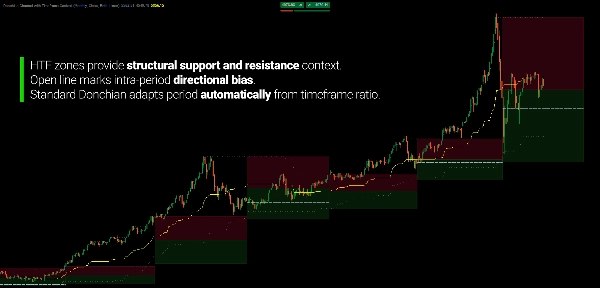
Seu período é calculado automaticamente a partir da razão entre o timeframe do seu gráfico e o timeframe de contexto selecionado. Por exemplo, um contexto Semanal em um gráfico H1 produz uma retrovisão de 120 barras.
Você não precisa decidir se o canal deve usar 20, 50 ou 100 barras.
A relação de timeframe define a retrovisão.
2. Contexto de Timeframe Superior
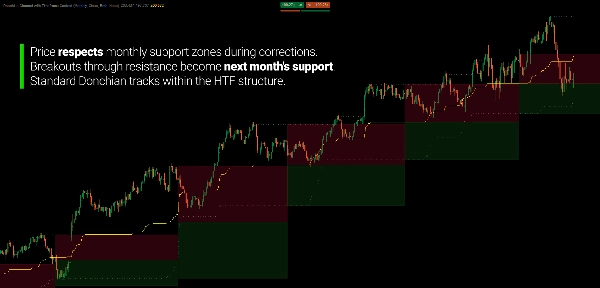
O intervalo do período de timeframe superior previamente concluído é projetado para frente no seu gráfico atual como zonas de suporte e resistência.
Seu intervalo é dividido em duas áreas:
Zona de Suporte
Do mínimo do período anterior até seu ponto médio.
Zona de Resistência
Do ponto médio até a máxima do período anterior.
À medida que o preço se desenvolve no seu timeframe atual, você pode ver imediatamente sua posição dentro desse intervalo maior.
DOIS TIMEFRAMES. UM GRÁFICO.
O Donchian do timeframe atual mostra o movimento se desenvolvendo em torno dos extremos recentes.
O intervalo de timeframe superior fornece a estrutura de referência maior.
Por exemplo:
Contexto Semanal → gráfico H1
ou
Contexto Diário → gráfico M5
O timeframe inferior permanece o movimento ativo.
O timeframe superior simplesmente fornece o intervalo ao redor.
O canal mostra o que o preço está fazendo. O timeframe superior mostra onde isso acontece.
O TIMEFRAME SUPERIOR NÃO SUBSTITUI O INFERIOR
O intervalo de timeframe superior não é um sinal que diz o que o preço deve fazer.
É uma estrutura de referência.
Um rompimento de timeframe inferior pode continuar através da resistência de timeframe superior.
Um recuo pode parar dentro do suporte de timeframe superior.
O preço também pode se mover completamente além do intervalo anterior e entrar em novo território.
O objetivo não é prever qual resultado ocorrerá.
É tornar o intervalo maior visível enquanto você observa o movimento menor se desenvolver.
DEIXE O CONTEXTO SE ATUALIZAR
As zonas de timeframe superior são baseadas no período previamente concluído.
Quando um novo período de timeframe superior começa, o intervalo de contexto é atualizado.
Por exemplo:
Semana Anterior → Semana Atual
A máxima, mínima e ponto médio da semana anterior tornam-se a referência para a semana atual.
Em um gráfico H1, esses limites permanecem visíveis enquanto o Canal Donchian do período atual continua a se desenvolver.
Você, portanto, obtém uma referência persistente sem desenhar manualmente o intervalo do período anterior.
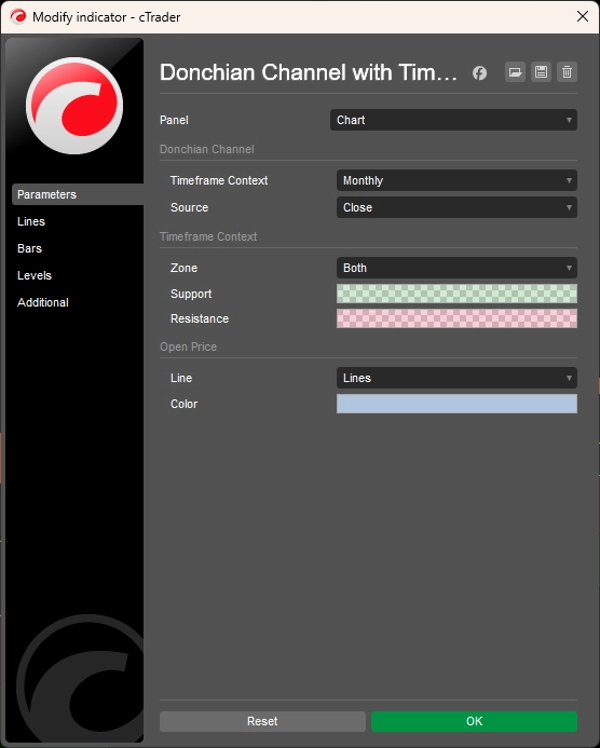
O CONTEXTO DE TIMEFRAME É SUA ESCOLHA
Escolha o timeframe superior que fornece o contexto que você deseja:
- Mensal
- Semanal
- Diário
- 4 Horas
- 1 Hora
- 30 Minutos
- 15 Minutos
- E outras combinações suportadas
O indicador lida automaticamente com o período Donchian correspondente.
Você escolhe o contexto. O cálculo se adapta a ele.
REFERÊNCIA OPCIONAL DE PREÇO DE ABERTURA
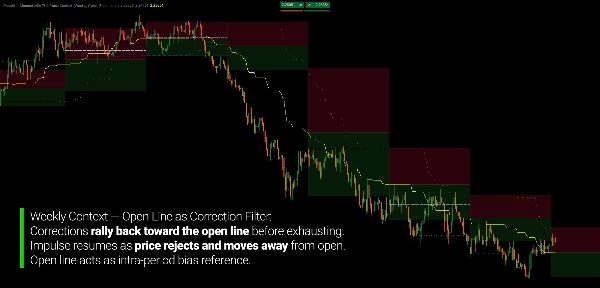
O preço de abertura do período atual de timeframe superior também pode ser exibido.
Isso lhe dá outra referência de onde o preço está negociando em relação ao preço de abertura do período atual de timeframe superior.
Ative-o quando quiser contexto adicional.
Oculte-o quando quiser que o gráfico esteja focado nas duas camadas Donchian.
ESCOLHA COMO O CANAL É CALCULADO
Os limites do Donchian podem ser calculados a partir de:
Fechamento
ou
Máxima / Mínima
O cálculo baseado no fechamento produz limites a partir dos preços de fechamento.
O cálculo Máxima/Mínima inclui os extremos completos dos pavios e, portanto, representa um intervalo de preço mais amplo.
A mesma seleção de fonte é aplicada consistentemente tanto para os cálculos do timeframe atual quanto do timeframe superior.
FEITO PARA CONTEXTO, NÃO PARA PERSEGUIR SINAIS
Canal Donchian com Contexto de Timeframe não é um sistema de previsão de rompimentos.
Ele não diz se um rompimento terá sucesso.
Ele lhe dá um ambiente definido no qual observá-lo.
Use-o para estudar:
- Rompimentos
- Recuos
- Limites de timeframe superior
- Posição dentro de um intervalo maior
- Expansão além dos extremos anteriores
- Geometria de preço multi-timeframe
- Movimento atual em relação ao período anterior
O Donchian padrão informa onde estão os extremos atuais.
O contexto de timeframe superior informa onde esses extremos estão dentro do intervalo maior.
CARACTERÍSTICAS PRINCIPAIS
- Canal Donchian padrão
- Cálculo automático do período do timeframe atual
- Projeção do intervalo de timeframe superior
- Zonas de contexto de suporte e resistência
- Máxima, mínima e ponto médio do período anterior
- 13 contextos de timeframe selecionáveis, de Mensal até Minuto 15
- Preço de abertura opcional do timeframe superior
- Modos de cálculo Fechamento ou Máxima/Mínima
- Exibição configurável da zona: Ambas, Apenas Suporte, Apenas Resistência ou Nenhuma
- Opções de exibição apenas Suporte / apenas Resistência
- Atualizações em tempo real
- Suporte para gráficos baseados em tempo e não baseados em tempo, incluindo Tick, Renko e Range
---
Negociar envolve riscos. Este indicador é uma ferramenta de análise técnica e deve ser usado junto com uma gestão de risco apropriada.
Resumo
This dual-layer system automatically adapts the Donchian lookback period based on the ratio between the selected higher timeframe and the chart timeframe, eliminating manual period settings. It supports 13 timeframe options from Monthly to 15 Minutes and can be applied across various markets including forex pairs (EURUSD, GBPUSD, USDJPY, NZDUSD), commodities (XAUUSD), indices (NAS100), and cryptocurrencies (BTCUSD).
Key features include real-time updates of both standard and higher-timeframe channels, configurable visual zones with adjustable colors and transparency, an optional open price line marking the higher-timeframe period’s open, and flexible price source settings (close or high/low).
The indicator aids traders in filtering false breakouts by showing whether price movements occur within structural supply or demand zones on a higher timeframe. It is designed for trend-following, swing, and discretionary traders who use Donchian channels and seek enhanced structural context to better assess breakout significance and correction exhaustion without switching timeframes.
Avaliações de clientes
Conversa
Perguntas frequentes
Mais deste autor























Preço