


Descrição
A IDEIA
Um Perfil de Volume que se adapta ao movimento exato do preço definido pelo intervalo selecionado em vez de forçar a análise em um período predefinido.
O PROBLEMA
A maioria das ferramentas de Perfil de Volume são construídas em torno de períodos predefinidos.
Sessões. Dias. Semanas. Retrospectivas fixas.
Mas o movimento de preço que você quer estudar raramente se encaixa perfeitamente nesses limites.
Uma perna de tendência pode começar no meio de uma sessão.
Uma correção pode abranger vários períodos.
Um movimento de oscilação a oscilação pode começar e terminar em qualquer lugar no gráfico.
O problema não é necessariamente o Perfil de Volume em si.
O problema é deixar o período de tempo decidir qual movimento de preço será analisado.
O CONCEITO CENTRAL: DEFINA O INTERVALO. DEIXE O PERFIL SE ADAPTAR A ELE.
O Perfil de Volume de Intervalo Personalizado inverte essa relação.
Em vez de perguntar:
"Qual período o perfil deve analisar?"
você define:
"Qual movimento de preço eu quero analisar?"
Dois pontos de ancoragem definem o intervalo.
O indicador mede a máxima mais alta e a mínima mais baixa entre os dois pontos de ancoragem, depois constrói o perfil de volume dentro desse intervalo de preço.
Isso faz com que o movimento de preço seja a referência principal em vez de um período predefinido.
Você define o intervalo. O perfil se adapta a ele.
O QUE ELE FAZ
Coloque dois pontos de ancoragem nas barras que você quer estudar.
O indicador constrói automaticamente um Perfil de Volume para esse intervalo usando o período de tempo fonte selecionado.
Mova qualquer um dos pontos de ancoragem, e o perfil recalcula imediatamente.
Você pode, portanto, definir e redefinir o movimento diretamente no gráfico sem estar limitado por limites de sessão, retrospectivas fixas ou outros períodos predefinidos.
Use-o para estudar:
- Uma perna de tendência inteira
- Uma correção ou consolidação
- O movimento entre dois pontos de oscilação
- Um impulso específico e seu recuo
- Qualquer outro movimento de preço que seja importante para sua análise
O perfil então mostra onde o volume se acumulou dentro desse movimento específico.
PERÍODO DE TEMPO FONTE AUTOMÁTICO
O intervalo selecionado e o período de tempo usado para calcular seu perfil não precisam ser os mesmos.
Quando o modo Auto está ativado, o indicador busca na sua lista configurada de períodos de tempo e seleciona o período mais detalhado capaz de cobrir o intervalo selecionado, permanecendo dentro do limite de processamento de 5.000 barras.
Isso permite que um grande intervalo histórico seja analisado usando um período de tempo fonte mais detalhado do que o gráfico que você está visualizando, quando disponível.
Por exemplo:
Gráfico H4 → intervalo selecionado de vários dias → período de tempo fonte mais detalhado como M1, M5 ou M15
Você também pode desativar o modo Auto e usar diretamente o período de tempo do gráfico.
TRÊS FORMAS DE LER O PERFIL
Escolha como você quer examinar a distribuição de volume:
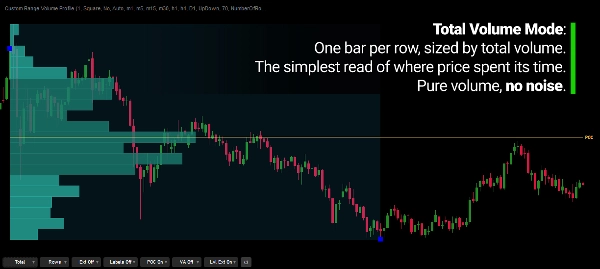
Total
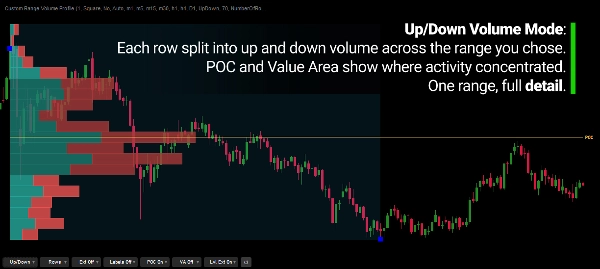
Mostra o volume total em cada linha de preço, facilitando ver onde a atividade foi concentrada.
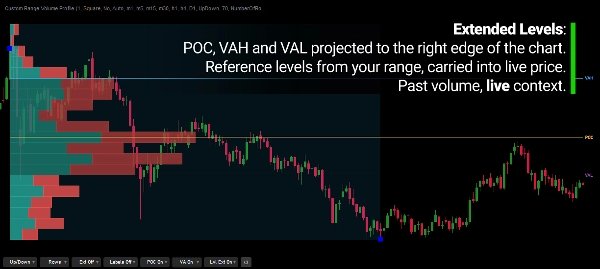
Alta / Baixa
Divide o volume de acordo com se a barra fonte fechou acima ou abaixo da sua abertura.
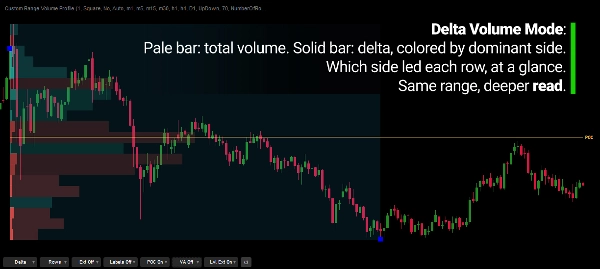
Delta
Exibe o volume total junto com a diferença entre o volume de alta e baixa.
O modo de exibição pode ser alterado diretamente nos controles do gráfico sem precisar reabrir as configurações do indicador.
NÍVEIS CHAVE
O perfil pode exibir:
- Ponto de Controle (POC) — a linha de preço com maior volume
- Valor Máximo da Área (VAH)
- Valor Mínimo da Área (VAL)
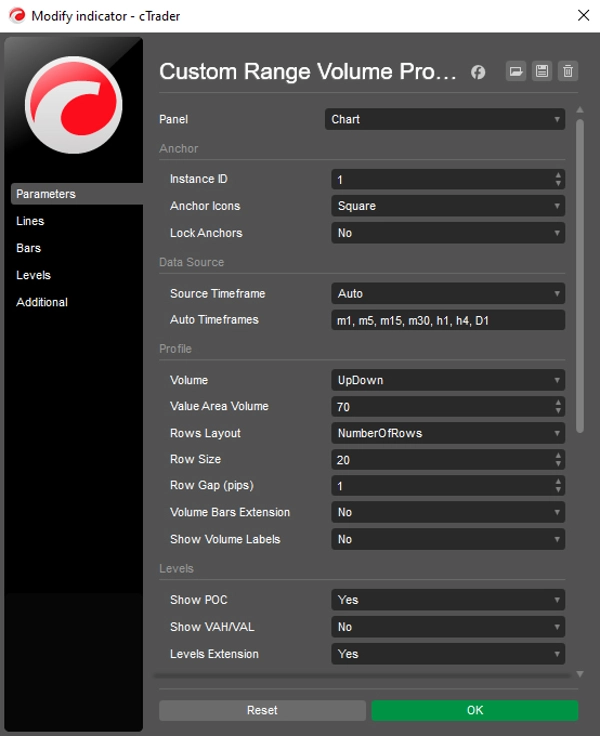
- Percentual configurável da Área de Valor, padrão 70%
- Extensões opcionais de nível
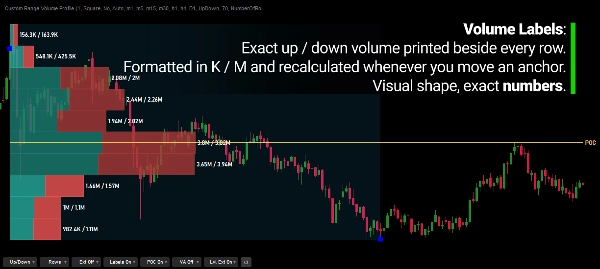
- Rótulos de volume
Esses níveis fornecem referências adicionais para entender onde a atividade se concentrou dentro do movimento selecionado.
O INTERVALO PERMANECE SOB SEU CONTROLE
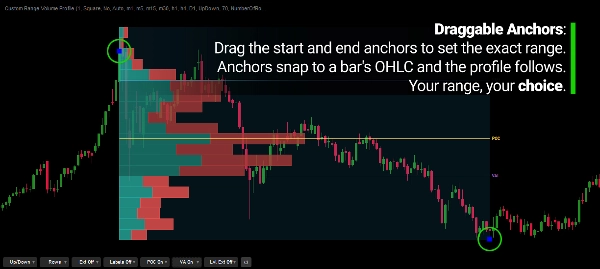
Os pontos de ancoragem podem ser movidos diretamente no gráfico, bloqueados para evitar movimentos acidentais, e podem se encaixar no:
- Abertura
- Máxima
- Mínima
- Fechamento
Isso lhe dá controle preciso sobre o que está incluído no perfil.
Altere o ponto inicial.
Altere o ponto final.
Altere o movimento que você está estudando.
O perfil segue o intervalo.
MÚLTIPLOS PERFIS. MÚLTIPLAS REFERÊNCIAS.
Vários perfis independentes podem ser exibidos no mesmo gráfico.
Cada perfil pode ter seu próprio intervalo e configurações, permitindo que diferentes movimentos de preço sejam analisados simultaneamente.
Por exemplo, um perfil pode representar um impulso enquanto outro cobre sua correção.
Os intervalos permanecem independentes.
RESOLUÇÃO FLEXÍVEL DO PERFIL
Escolha como o perfil divide o preço:
Linhas Alvo
Defina o número aproximado de linhas de preço, com o tamanho do tick por linha selecionado automaticamente para chegar o mais próximo possível desse alvo.
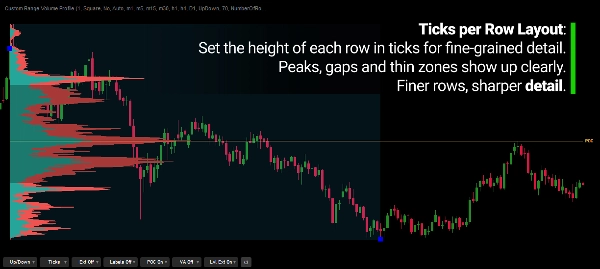
Ticks Por Linha
Defina a resolução de preço diretamente pelo número de ticks atribuídos a cada linha.
Isso permite que o perfil seja visualizado em diferentes níveis de granularidade dependendo do movimento estudado.
CONTROLES NO GRÁFICO
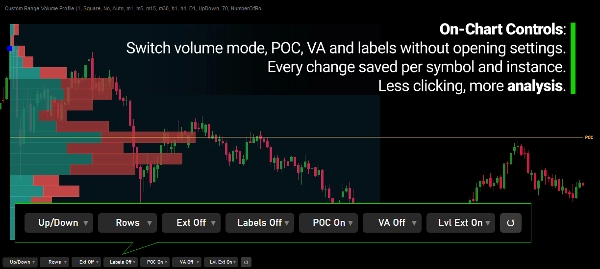
Configurações usadas com frequência podem ser ajustadas diretamente no gráfico.
Altere:
- Modo de volume
- Layout das linhas
- Extensões
- Rótulos
- Visibilidade do POC
- Visibilidade da Área de Valor
sem precisar reabrir repetidamente as configurações do indicador. A barra de controle pode ser posicionada em qualquer canto ou ocultada, e as alterações são salvas por símbolo e por instância.
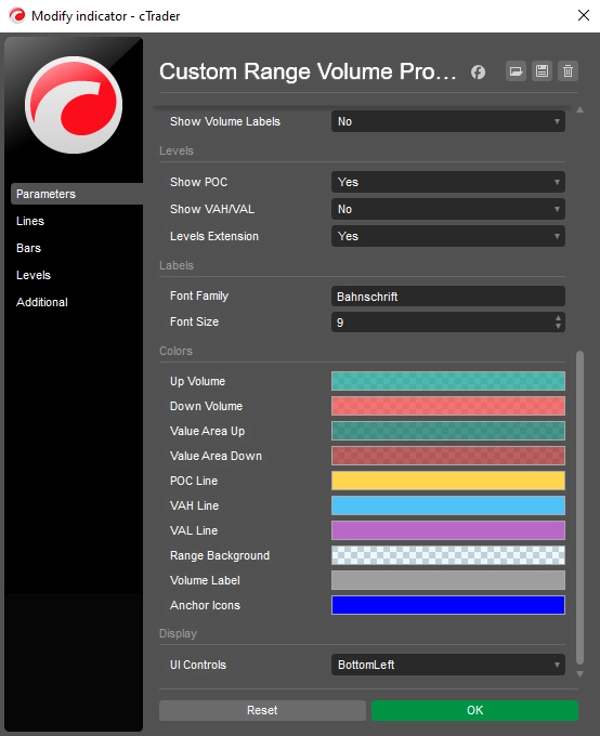
EXIBIÇÃO PERSONALIZÁVEL
A apresentação visual pode ser ajustada para se adequar ao seu fluxo de trabalho.
Personalize elementos como:
- Cores
- Fontes
- Rótulos
- Extensões
- Outros parâmetros de exibição
O cálculo subjacente permanece independente da apresentação visual.
LENDO O PERFIL
Um Perfil de Volume descreve onde a atividade se acumulou ao longo do preço durante o intervalo selecionado.
Áreas de volume intenso indicam preços onde houve mais atividade, enquanto áreas finas indicam preços com menos volume acumulado.
A forma do perfil pode fornecer um contexto útil:
- Volume concentrado → atividade acumulada em torno daquela área de preço
- Áreas finas entre nós mais pesados → atividade relativamente menor acumulada nesses preços
- POC perto de uma das extremidades do intervalo → a atividade foi concentrada para um lado do movimento selecionado
Estas são observações sobre o que já aconteceu.
Elas não são previsões do que o preço deve fazer a seguir.
DADOS E CÁLCULO
Este indicador usa volume de ticks fornecido pelo feed de dados do seu corretor.
O volume de cada barra fonte é distribuído ao longo do intervalo de preço dessa barra.
Alta/Baixa e Delta classificam as barras fonte de acordo com sua abertura e fechamento.
Portanto, Delta representa volume direcional da barra, não o fluxo real de ordens de compra/venda da bolsa.
O resultado é uma aproximação consistente e reproduzível da distribuição de volume para o intervalo que você escolher.
FEITO PARA ANÁLISE DE INTERVALO DE PREÇO
O Perfil de Volume de Intervalo Personalizado é projetado para estudar a distribuição de volume dentro de um movimento de preço definido, em vez de perfilar automaticamente um período de tempo arbitrário.
Use-o para examinar:
- Distribuição de volume dentro de tendências
- Impulsos e correções
- Movimentos de oscilação a oscilação
- Áreas de alto e baixo volume
- POC e Área de Valor
- Aceitação de preço e áreas mais finas de atividade
- Distribuições de volume diferentes em diferentes movimentos de preço
- Múltiplos intervalos independentes no mesmo gráfico
O indicador não decide qual movimento importa.
Você define o intervalo. Ele constrói o perfil.
CARACTERÍSTICAS PRINCIPAIS
- Dois pontos de ancoragem arrastáveis com bloqueio opcional
- Ancoragem com encaixe em Abertura, Máxima, Mínima ou Fechamento
- Perfil de intervalo de preço personalizado
- Seleção automática do período de tempo fonte a partir de uma lista configurável
- Opção manual de período de tempo fonte
- Modos Total / Alta-Baixa / Delta
- Ponto de Controle
- Valor Máximo / Mínimo da Área
- Percentual configurável da Área de Valor
- Linhas Alvo ou Ticks Por Linha
- Múltiplos perfis independentes
- Controles no gráfico
- Rótulos de volume opcionais e extensões de POC / Área de Valor
- Exibição visual personalizável
- Cálculo baseado em volume de ticks
---
Negociar envolve riscos. Este indicador é uma ferramenta de análise técnica e deve ser usado junto com uma gestão de risco apropriada.
Resumo
Key features include three volume modes—Total, Up/Down, and Delta—that show different perspectives of volume activity. The indicator identifies the Point of Control (POC), the price level with the highest volume, and the Value Area, which covers a configurable percentage of total volume, with optional display of Value Area High (VAH) and Value Area Low (VAL) levels. Users can customize row layout, volume bar extensions, labels, colors, and on-chart controls for mode switching and display options.
Designed for swing, intraday, structure-based, and discretionary traders, this tool provides a contextual framework to understand where volume concentrated during specific moves, aiding in identifying key support and resistance levels based on volume distribution. Multiple independent profiles can be used simultaneously on the same chart.
Avaliações de clientes
5 | 100 % | |
4 | 0 % | |
3 | 0 % | |
2 | 0 % | |
1 | 0 % |
Conversa
Perguntas frequentes
Mais deste autor






















Preço