present
Registe-se e receba 50 $ de desconto na sua primeira compra
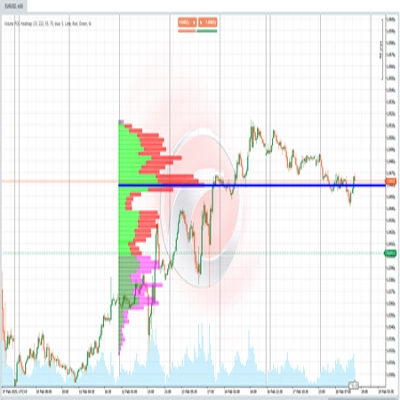
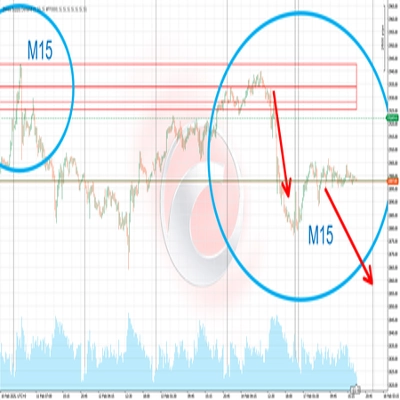
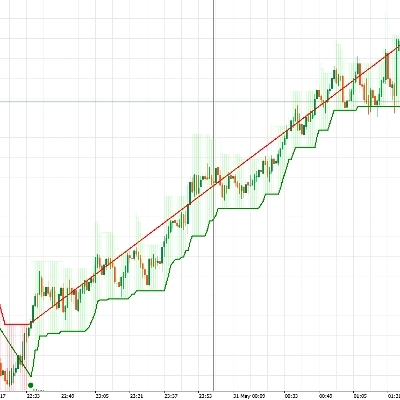
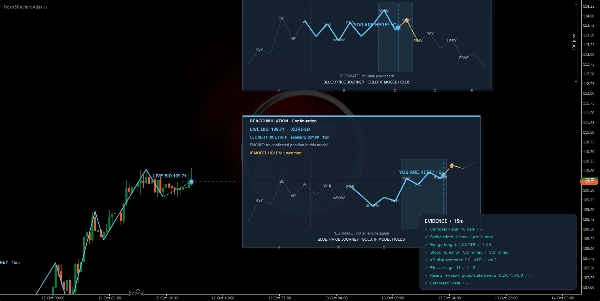
Trading product for NexoStructureAtlas Indicador Key Levels MSS, image 1
NexoStructureAtlas
Indicador
Versão 1.0, Oct 2026
Windows, Mac
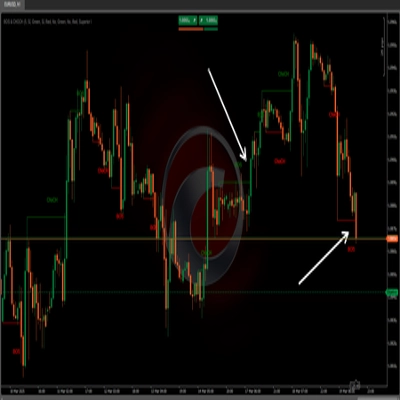
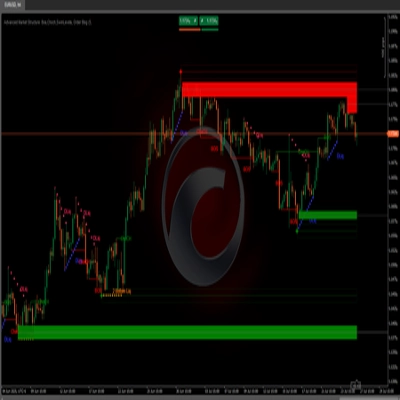
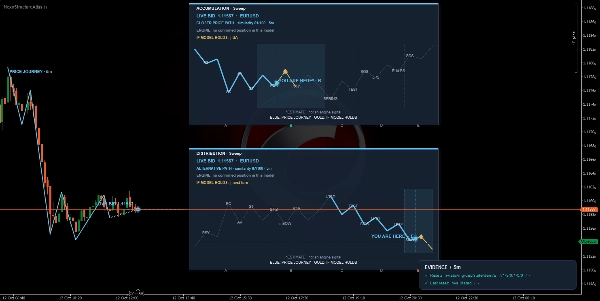
Trading product for NexoStructureAtlas Indicador Key Levels MSS, image 2
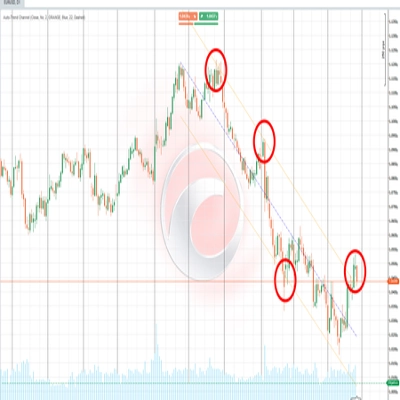
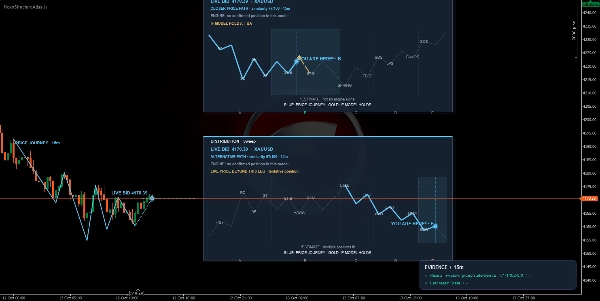
Trading product for NexoStructureAtlas Indicador Key Levels MSS, image 3
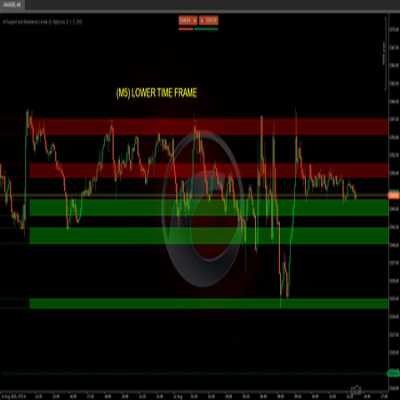
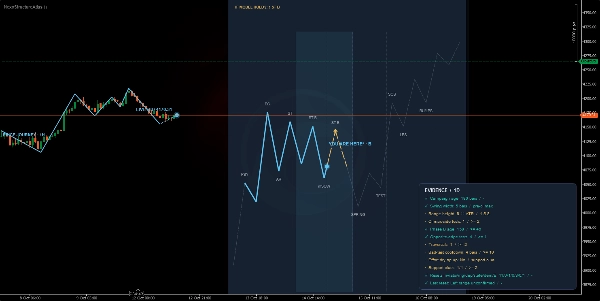
Trading product for NexoStructureAtlas Indicador Key Levels MSS, image 4
Trading product for NexoStructureAtlas Indicador Key Levels MSS, image 5
Desde 03/10/2024
177
Vendas
45.22K
Instalações gratuitas

Descrição

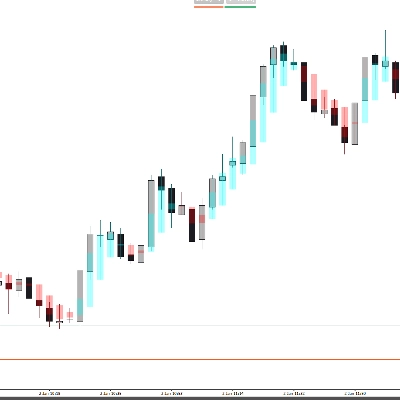
Nexo Structure Atlas is a professional-grade technical analysis tool designed for traders who operate based on market structure and institutional cycle dynamics. The indicator automates the identification of ranges, structural phases, and key turning points, projecting intuitive visual guides directly onto the chart.

📊 Market data and conditions analyzed

https://chartshots.spotware.com/c/6acd2589646ae

The indicator processes price action on both the current chart and higher timeframes. It analyzes:

  • Price ranges, ATR amplitudes, and swing widths (pivots).
  • Development and transition of accumulation, distribution, reaccumulation, and redistribution phases.
  • Stopping actions, terminal tests, and institutional support/resistance liquidity levels.

https://chartshots.spotware.com/c/6acd25cee9110

👁️ How to interpret visual elements and signals

https://chartshots.spotware.com/c/6acd260deee0e

  • Reference Cards: Optional overlapping panels showing ideal schemas of the current cycle (e.g., sweep or accumulation/distribution models), allowing you to visually compare where the price is within the theoretical model.
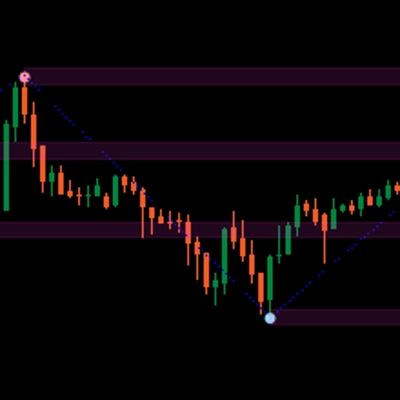
  • Price Journey Trace: Draws significant price movements and swings on the chart to clearly visualize trend structure and character changes.
  • Entry Badges: Visual markers on the chart signaling potential high-probability opportunities at key structural points (such as phase tests, support/resistance tests, and trend confirmations) according to the configured filtering policy.
  • Evidence and Summary Dashboard: A discreet informational panel detailing critical metrics of the current campaign: phase age, range height in ATR, validation status, and support metrics.

⚙️ Key settings and parameters

https://chartshots.spotware.com/c/6acd26ad835f3

The indicator offers extensive customization divided into groups accessible from cTrader:

  • Reference Atlas: Model selection (automatic or manual), number of visible reference cards, horizontal offset, and typography size.
  • Structure and History: Activation of live paths, higher timeframe historical analysis, and filtering by minimum phases.
  • Signals and Context: Entry qualification policies (Conservative, Standard, Aggressive) and selection of additional entry triggers.
  • Dashboard and Visual Identity: Full color customization (jade tones for demand, coral for supply, surface and text colors), range opacities, line thicknesses, and sound alerts for confirmed entries.

🎯 Use cases and trading scenarios

  • Institutional Range Identification: Ideal for detecting when an asset is building cause (accumulation/reaccumulation) or effect (distribution/redistribution).
  • Turning Point Trading: Using entry badges and phase tests to look for position entries favoring the main structural movement with defined risk management.

⚠️ Important limitations and usage notes

  • The indicator requires time-based charts (minutes, hours, days, weeks, or months).
  • It is an advanced technical analysis and decision-support tool; it does not constitute automated financial advice or guarantee profits on its own. Proper risk management and validation with your own operational strategy are recommended.

Resumo

Perfil do indicador
Categoria do indicador
Estrutura do mercado (SMC)
Tipo de resultado
Visualização
Sinais
Requisitos de dados
Apenas barras
Sinais suportados
Quebra
Inversão
Toque no nível
Quebra de nível

Avaliações de clientes

0.0
Avaliações: 0
Avaliações de clientes
Ainda não há avaliações para este produto. Já o experimentou? Seja o primeiro a contar a outras pessoas!

Conversa

Perguntas frequentes

Key Levels
MSS
CHOCH
Market Structure
ATR
Liquidity Grab
Support & Resistance
Os produtos disponíveis através da cTrader Store, incluindo bots de negociação, indicadores e plugins, são fornecidos por programadores terceiros e são disponibilizados apenas para fins informativos e de acesso técnico. A cTrader Store não é um corretor e não fornece aconselhamento em matéria de investimento, recomendações pessoais ou qualquer garantia de desempenho no futuro.

Mais deste autor

Logótipo de "ZigZag"
Bem avaliado
4.3
(6)
Grátis
Indicador
ATR
RSI
+7
ZigZag filters noise, spots trends, patterns, pivots, aiding analysis, trade management, and confirmations. 📉📈
Indicador
ATR
RSI
+7
Identify bullish and bearish Order Blocks to spot key support/resistance levels and potential trend reversals! 📈🔄
Indicador
ATR
RSI
+7
📊 Shows volume by price levels, highlights POC, and key zones. Identifies dynamic support/resistance and imbalances.
Indicador
ATR
RSI
+6
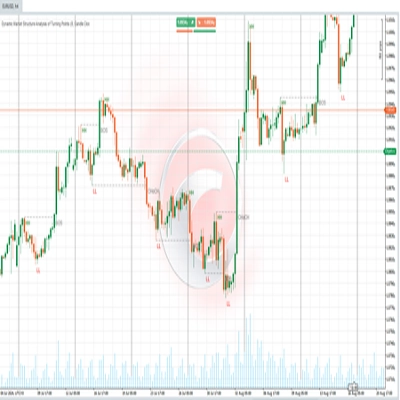
Market structural patterns , specifically the concepts of Change of Character (ChoCH) 🔄 and Break of Structure (BoS) 💥
Indicador
ATR
RSI
+6
Adaptive trend channel using linear regression and Pearson correlation for dynamic support, resistance, and trends.
Indicador
RSI
Breakout
+1
"Identify key market zones and visualize support/resistance from multiple timeframes on a single chart.
Plugin multiplataforma
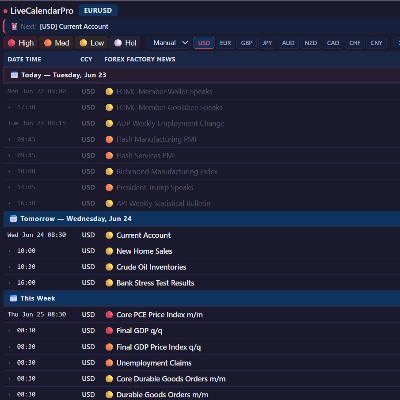
Economic Calendar
Displays live economic events directly inside your cTrader charts.
Indicador
ATR
RSI
+6
💹 Define a price channel 📈 and determine trend direction (bullish 🟢 or bearish 🔴).
Indicador
ATR
RSI
+7
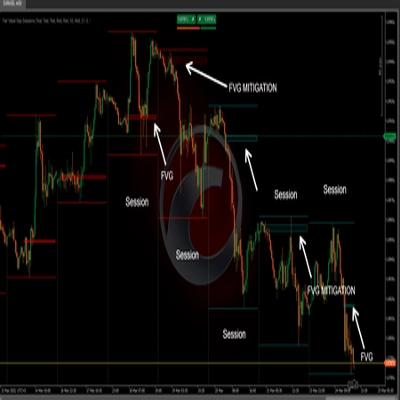
identify and highlight temporary market inefficiencies known as "fair value gaps" 🚨 within specific trading Sessions.
Indicador
RSI
BTCUSD
+5
Identify market structure effortlessly with swing highs, lows, CHoCH, and BOS levels for smart trading decisions! 📊🔍"
Indicador
ATR
RSI
+6
📊Zones Supply & Demand: Identifies key price levels with high volume concentration, marking Supply/Demand Zones & Marke
Indicador
Advanced price action tool that combines multiple technical analysis concepts

Também poderá gostar de

Indicador
AI
Forex
+3
Smart Money FVG & Imbalance Detector – Precision Institutional Tool
Indicador
Volume
Custom range volume profile between two draggable anchors. Auto source timeframe, Total/Up-Down/Delta, POC, Value Area.
Indicador
ATR
Forex
+7
Final Moving Average is an adaptive system designed to keep traders aligned with the true direction of the market
Indicador
Imbalance
Inside Bar
+3
A clean and powerful Smart Money Concepts tool combining Fair Value Gaps, Previous Daily High/Low, Inside/Outside bar
Indicador
ATR
RSI
+1
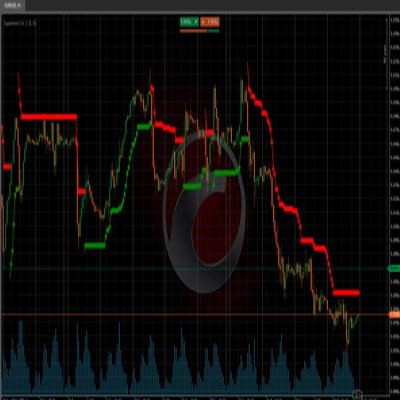
Super Trend Rsi ,ATR + trend change distance + dynamic Alpha, divergence/convergence
Indicador
ATR
RSI
+14
A metric that can set 1 to 3 groups of Bollinger Bands
Indicador
ATR
RSI
+3
🚀 Specialized algorithm is designed to confirm entry and exit points with precision 🎯
Indicador
Doji
Volume
+5
Instantly spot high-liquidity institutional moves with clean, non-obtrusive triangle alerts on cTrader charts.
Indicador
Forex
Crypto
+4
Pro Heikin Ashi Visual Overlay – Clean Trend Visualization
Indicador
RSI
RSI on the main chart with 45/55 momentum levels, overbought/oversold levels, averaged RSI, and multi-timeframe support.
Indicador
RSI
Forex
+6
What Constance Brown did with the RSI was to input a momentum calculation within the RSI itself. This the Composite RSI.
Indicador
ATR
Wedge
+2
Strong Supertrend Turn Market Movement into a Clear Map Market analysis
Indicador
AI
ATR
+27
Deep Mood Distribution (DMD) is a segmented volume-profile and sentiment tool that analyzes price action in fixed bar bl
Indicador
MACD
Prop
+14
Enhance MACD Histogram! Visualize bull and bear price changes with vibrant colors for clearer, more insightful trading.
Indicador
Prop
Forex
+4
Automatic Support/Resistance zones from swing points.
Indicador
AI
Prop
+9
A cutting‑edge trading indicator that fuses AI and mathematics with adaptive logic to classify market regimes.
Indicador
Prop
VWAP
+5
Multi-anchor VWAP indicator for cTrader. Plots two VWAP lines (red and blue) with selectable anchors.
Logótipo de "supertrend"
Popular
4.3
(3)
$20
Indicador
ATR
Prop
+4
Supertrend Indicator

Preço

Desde 03/10/2024
177
Vendas
45.22K
Instalações gratuitas