Descrição
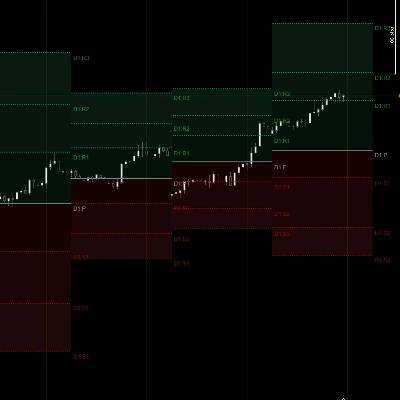
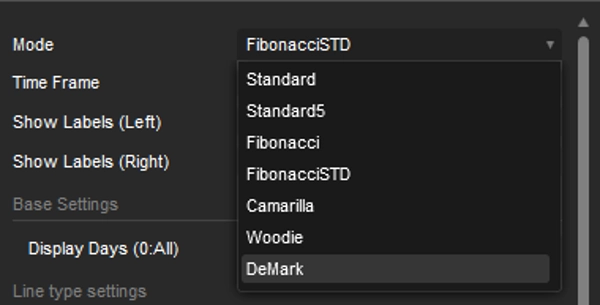
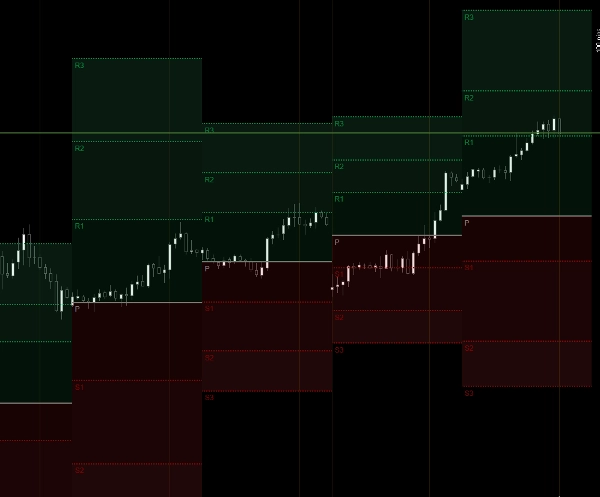
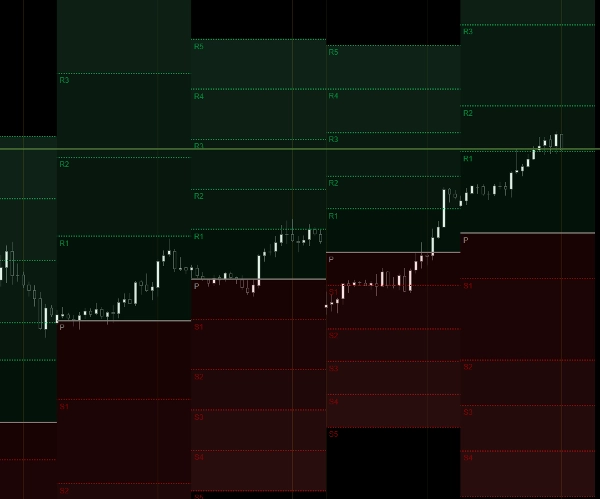
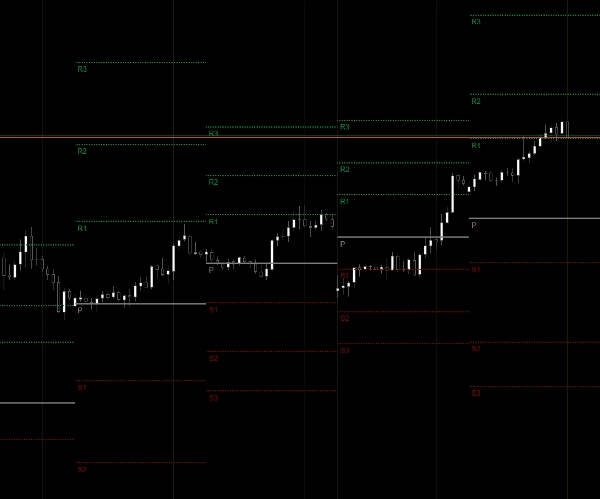
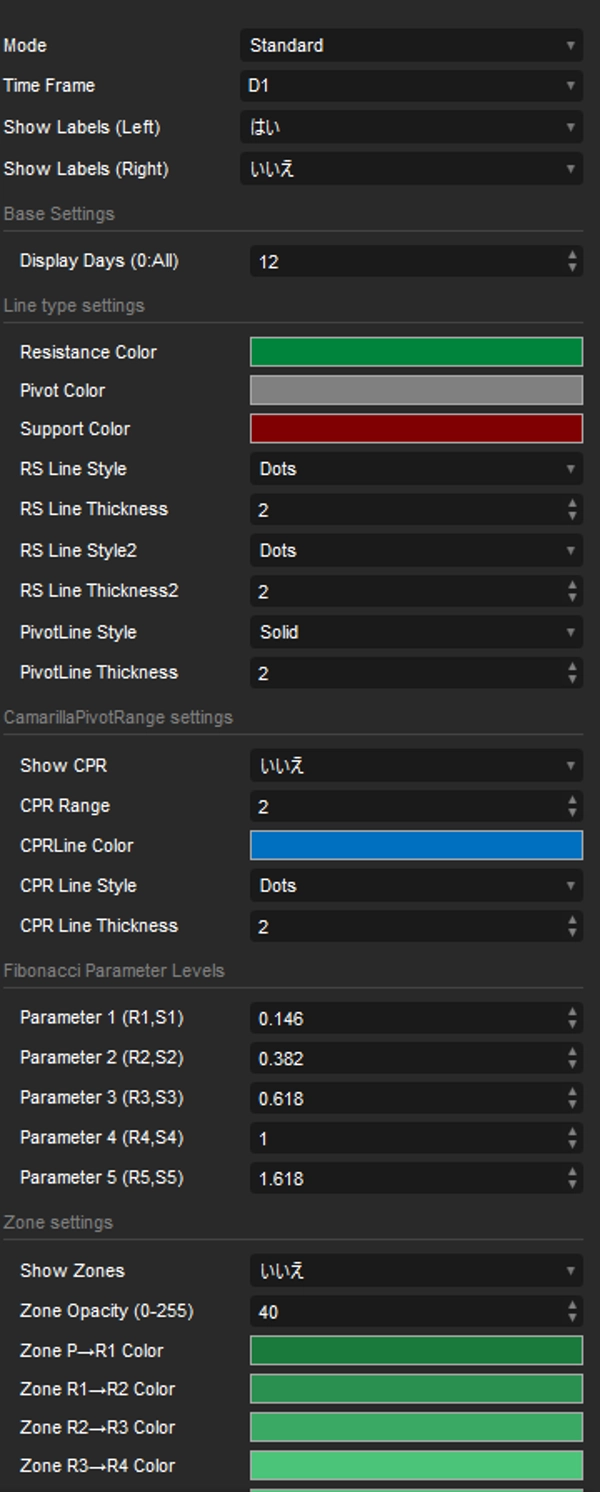
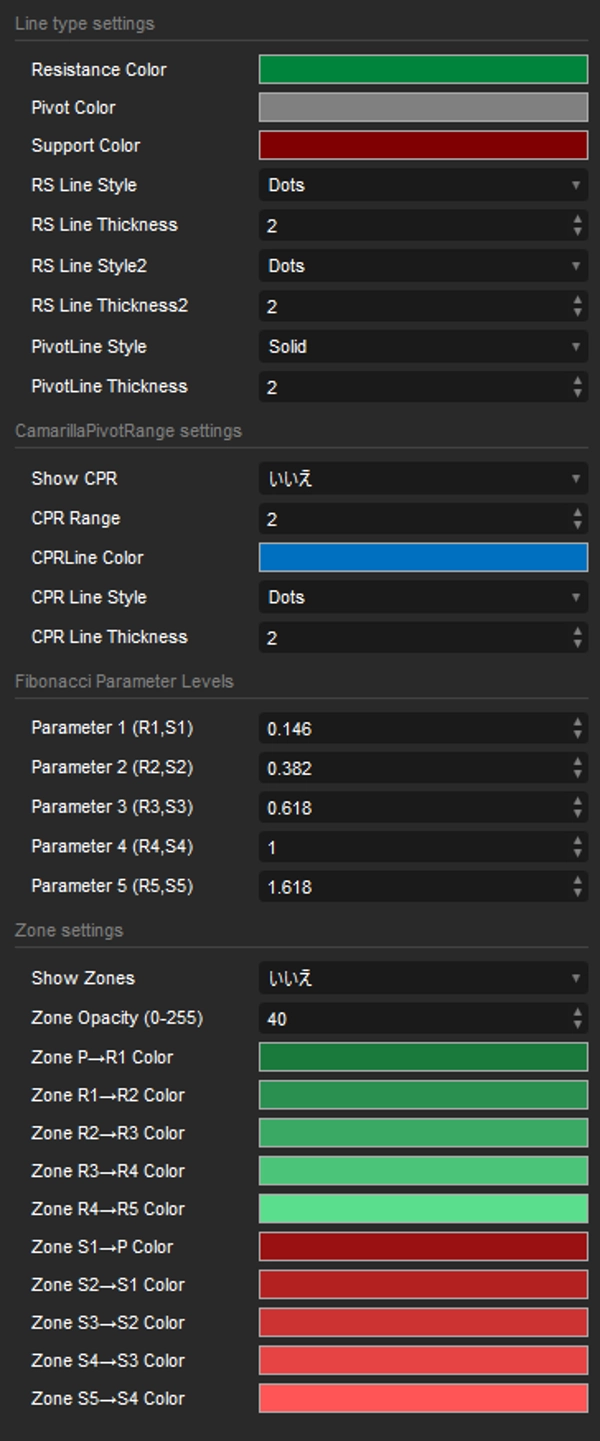
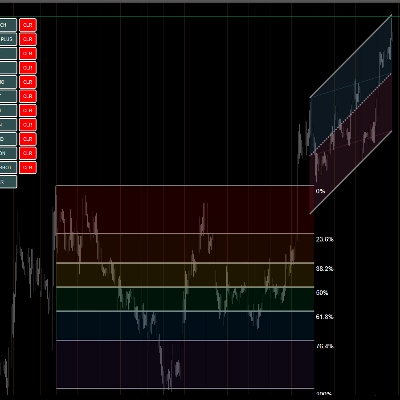
AllPivotPointPro é uma ferramenta completa de análise de pontos pivô que suporta os modos Standard, Fibonacci, Camarilla, Woodie e DeMark. Ele desenha automaticamente níveis de pivô, suporte e resistência, intervalos CPR e zonas multinível com cores e opacidade personalizáveis. O indicador exibe tanto rótulos do lado esquerdo quanto rótulos de preço baseados em TF do lado direito (por exemplo, D1:R1), facilitando a leitura da estrutura intradiária. A sombreamento da zona entre cada nível fornece um contexto visual claro, enquanto o DisplayDays permite visibilidade histórica seletiva. Projetado para traders que dependem de mapeamento de pivô preciso, limpo e multimodal para tomada de decisão diária e intradiária.
Resumo
Perfil do indicador
Avaliações de clientes
0.0
Avaliações: 0
Avaliações de clientes
Ainda não há avaliações para este produto. Já o experimentou? Seja o primeiro a contar a outras pessoas!
Conversa
Perguntas frequentes
Support & Resistance
Os produtos disponíveis através da cTrader Store, incluindo bots de negociação, indicadores e plugins, são fornecidos por programadores terceiros e são disponibilizados apenas para fins informativos e de acesso técnico. A cTrader Store não é um corretor e não fornece aconselhamento em matéria de investimento, recomendações pessoais ou qualquer garantia de desempenho no futuro.
Mais deste autor


![Logótipo de "Smart Money Concepts (SMC) [Iridio Capital]"](https://cdn.ctrader.com/image/webp/28b69fd1-ef54-4bed-9487-07e78e883be4_40934)


Preço
Desde 30/01/2025