present
سجل واحصل على خصم 50 دولارًا على مشترياتك الأولى
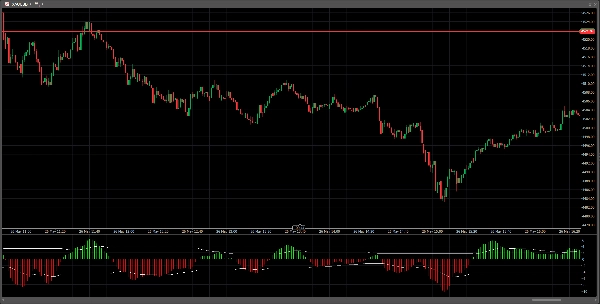
Trading product for Elliot Wave Oscillator PRO مؤشر Fibonacci EMA, image 1
Elliot Wave Oscillator PRO
مؤشر
الإصدار 1.0، May 2026
Windows, Mac
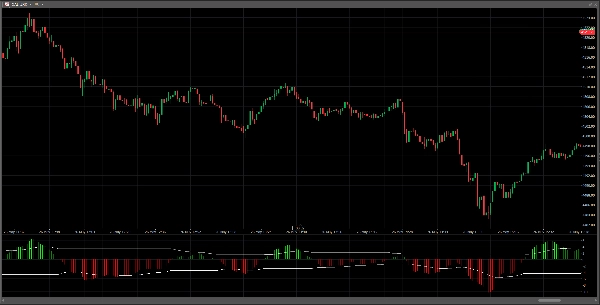
Trading product for Elliot Wave Oscillator PRO مؤشر Fibonacci EMA, image 2
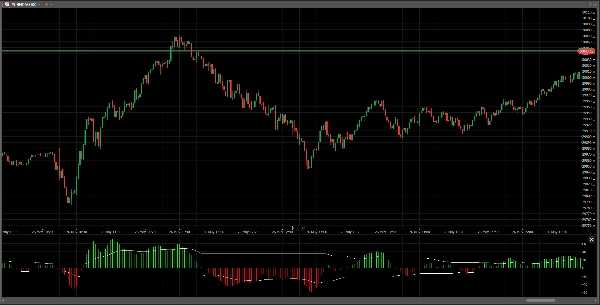
Trading product for Elliot Wave Oscillator PRO مؤشر Fibonacci EMA, image 3
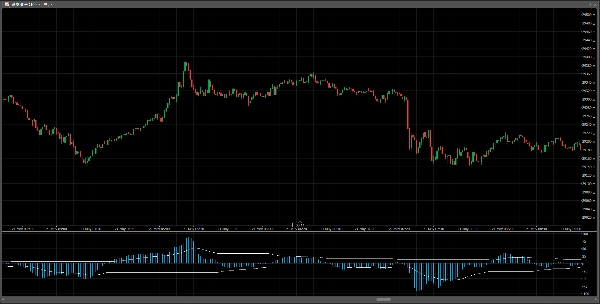
Trading product for Elliot Wave Oscillator PRO مؤشر Fibonacci EMA, image 4
Trading product for Elliot Wave Oscillator PRO مؤشر Fibonacci EMA, image 5
Trading product for Elliot Wave Oscillator PRO مؤشر Fibonacci EMA, image 6
Trading product for Elliot Wave Oscillator PRO مؤشر Fibonacci EMA, image 7
Trading product for Elliot Wave Oscillator PRO مؤشر Fibonacci EMA, image 8
Trading product for Elliot Wave Oscillator PRO مؤشر Fibonacci EMA, image 9
Trading product for Elliot Wave Oscillator PRO مؤشر Fibonacci EMA, image 10
منذ 05/09/2025
252.09M
حجم التداول
5.82K
الربح بالبيب
125
التثبيتات المجانية

الوصف

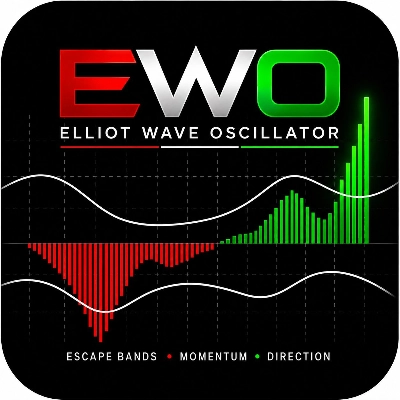
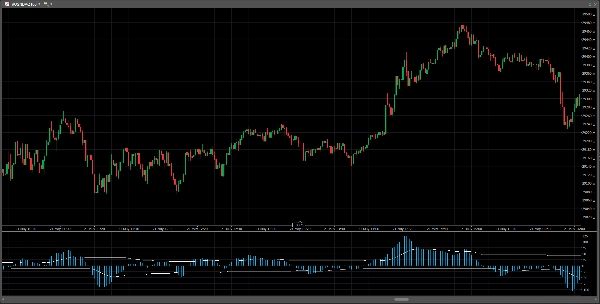
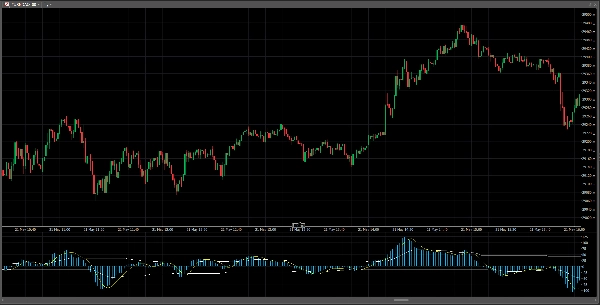
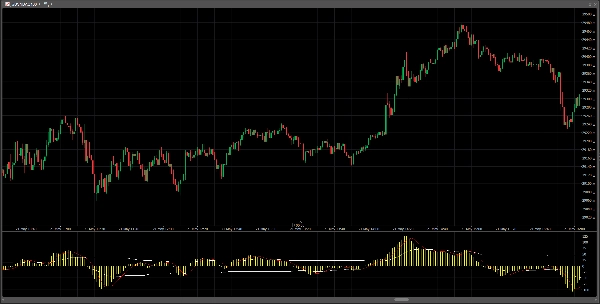
EWO PRO (مذبذب موجة إليوت)


يُعد EWO أداة قيمة للمتداولين الذين يسعون للحصول على رؤية شاملة للسوق واتخاذ قرارات مستنيرة.


1) نظام التداول:

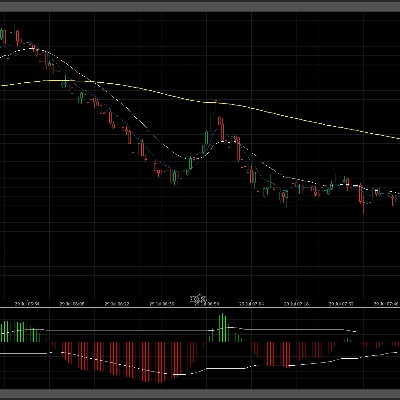
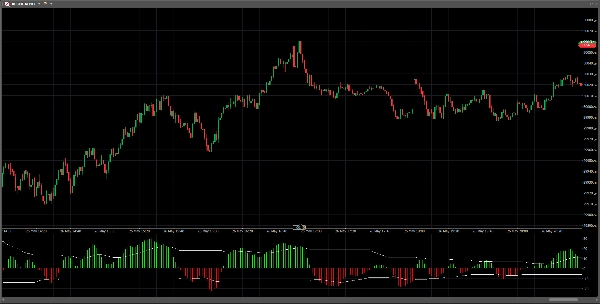
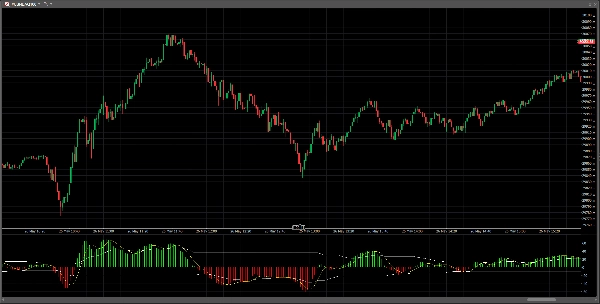
يعمل كنظام تداول بحد ذاته. يوفر إشارة شراء عندما يعبر المدرج التكراري خط الصفر صعودًا وإشارة بيع عندما يعبر المدرج التكراري خط الصفر هبوطًا.


2) يشير إلى الزخم:

يشير الزخم إلى القوة والسرعة التي يتحرك بها السعر. إذا زاد الزخم، فهذا يعني أن حركة السعر أصبحت أقوى (المزيد من المشترين أو البائعين يدفعونه). إذا انخفض الزخم، تفقد الحركة قوتها، على الرغم من أن السعر قد يستمر في نفس الاتجاه. عندما تكسر أشرطة المدرج التكراري لـ EWO نطاق الاختراق، سواء صعودًا أو هبوطًا، فهذا يشير إلى أن الزخم قوي بشكل استثنائي وأن السوق يدخل في مرحلة اندفاعية قوية جدًا.


3) مدقق عد الموجات:

يسمح بتحديد والتحقق من الموجات (الاندفاعات والتصحيحات) ضمن نظام العد المقترح من قبل إليوت.


قم بضبط الألوان حسب رغبتك واختيارك.


EWO (مذبذب موجة إليوت)

يُعد EWO أداة قيمة للمتداولين الذين يسعون للحصول على رؤية كاملة للسوق واتخاذ قرارات مستنيرة.


1) نظام التداول:

يعمل كنظام تداول بحد ذاته. يوفر إشارة شراء عندما يعبر المدرج التكراري خط الصفر صعودًا وإشارة بيع عندما يعبر المدرج التكراري خط الصفر هبوطًا.


2) يشير إلى الزخم:

يشير الزخم إلى القوة والسرعة التي يتحرك بها السعر.

إذا زاد الزخم، فهذا يعني أن حركة السعر أصبحت أقوى (المزيد من المشترين أو البائعين يدفعونه).

إذا انخفض الزخم، تفقد الحركة قوتها، على الرغم من أن السعر قد يستمر في نفس الاتجاه.


عندما تكسر أشرطة المدرج التكراري لـ EWO نطاق الاختراق، سواء صعودًا أو هبوطًا، فهذا يشير إلى أن الزخم قوي بشكل استثنائي وأن السوق يدخل في مرحلة اندفاعية قوية جدًا.


3) مدقق عد الموجات:

يسمح بتحديد والتحقق من الموجات (الاندفاعات والتصحيحات) ضمن نظام العد المقترح من قبل إليوت.


قم بضبط الألوان حسب رغبتك واختيارك.

الملخص

ملخص الذكاء الاصطناعي
Elliot Wave Oscillator PRO (EWO PRO) is a technical indicator designed to identify trading trends and opportunities in financial markets. It functions as a standalone trading system by generating buy signals when its histogram crosses above the zero line and sell signals when it crosses below. The indicator measures momentum—the strength and speed of price movements—indicating stronger market impulses when histogram bars break breakout bands. Additionally, EWO PRO serves as a wave count validator, helping traders identify and confirm Elliott Wave impulses and corrections within the Elliott counting framework. Users can customize the histogram colors to their preference. The indicator supports analysis based on momentum and trend strength and operates using bar data inputs. It is categorized under trend indicators and provides signals related to crossovers, divergences, and trend strength.
ملف تعريف المؤشر
فئة المؤشر
الاتجاه
نوع المخرجات
فلتر
متطلبات البيانات
أعمدة السعر فقط
الإشارات المدعومة
تقاطع
التباين
قوة الاتجاه

مناقشة

تقييمات العملاء

0.0
التقييمات: 0
تقييمات العملاء
لا توجد تقييمات لهذا المنتج حتى الآن. هل جرَّبته بالفعل؟ كن أول من يخبر الآخرين!

الأسئلة الشائعة

Fibonacci
EMA
MACD
يتم توفير المنتجات المتاحة من خلال cTrader Store، بما في ذلك روبوتات التداول والمؤشرات والإضافات، من قبل مطوري الطرف الثالث وإتاحتها لأغراض الوصول المعلوماتي والفني فقط. cTrader Store ليس وسيطًا ولا يقدم نصائح استثمارية أو توصيات شخصية أو أي ضمان للأداء المستقبلي.

المزيد من هذا المؤلف
مؤشر
ADX
Breaker Block
+1
I share with you the Elliott Wave Oscillator. Hernan Nievas, Rosario, Argentina. April 28, 2026.
مؤشر
EMA
Fibonacci
+1
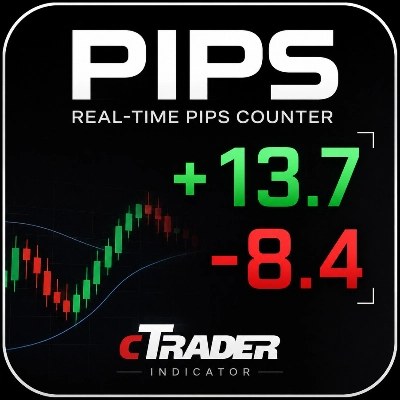
Shows the Pips of your open trade in real time with a clear and customizable display. Rosario, Argentina Julio 28, 2026.
مؤشر
Doji
Engulfing
+1
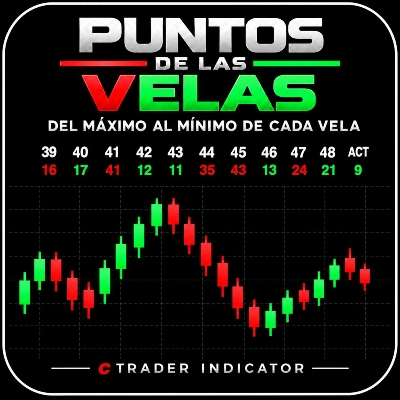
Mide en puntos la distancia entre el Máximo y el Mínimo alcanzados por cada vela, incluida la vela actual.

قد يعجبك أيضًا

مؤشر
The Break of Structure (BoSCHoCh) Indicator is a smart market structure tool designed to help traders easily spot trend.
مؤشر
Prop
Forex
+2
⚔️ JPY Samurai Breakout Pro — Professional Breakout Indicator for cTrader ⚔️
مؤشر
Forex
Crypto
+6
The cTrader Chaos Reversals indicator brings high-quality reversal signals to traders.
مؤشر
SMC
Forex
+4
Identifies institutional zones with Volume Delta (K) across any asset or chart for high-precision entry detection.
شعار "Equity and Balance"
الأعلى تقييمًا
4.4
(5)
$19
/
$35
مؤشر
Prop
Forex
+4
Displays real-time balance, equity, P&L, margin metrics directly on your charts.
مؤشر
ATR
BOS
+5
Market structure with BOS and CHoCH, order blocks, and retest buy/sell arrows with entry, stop and two targets
مؤشر
ADX
ATR
+2
GOLD SENTINEL v1.0 - A CANDLE-COLORING INDICATOR FOR GOLD.
شعار "SmartBot-MCDX Indicator"
الأعلى تقييمًا
4.4
(5)
$19
/
$20
مؤشر
MCDX is a powerful and innovative indicator.
مؤشر
Volume
Imbalance
+1
Volume profile indicator that auto-detects the latest trendline. Shows POC, Value Area (VAH/VAL), and High Volume Nodes
مؤشر
Indices
this indicator shows previous day high low and closed with precise manner.
مؤشر
ATR
Wedge
+2
Strong Supertrend Turn Market Movement into a Clear Map Market analysis
مؤشر
ATR
RSI
+14
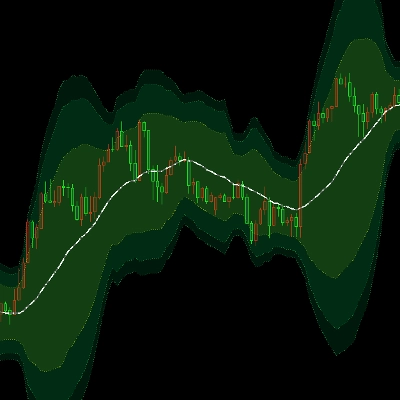
A metric that can set 1 to 3 groups of Bollinger Bands
مؤشر
BOS
CHOCH
+5
A professional-grade cTrader indicator for traders following the Inner Circle Trader (ICT) methodology.
مؤشر
RSI
Breakout
+1
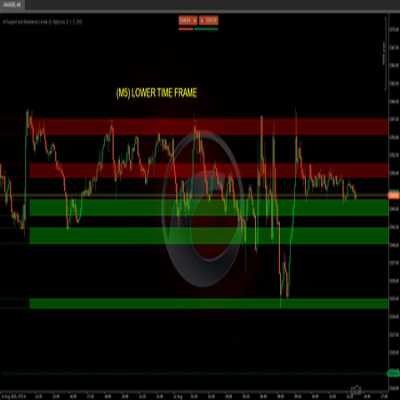
"Identify key market zones and visualize support/resistance from multiple timeframes on a single chart.
مؤشر
Prop
Forex
+5
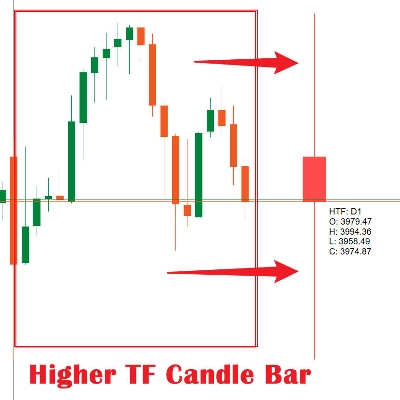
Higher TimeFrame Candle Tracker: Current Timeframe (Any TimeFrame) Show High TimeFrame Candle Bar
مؤشر
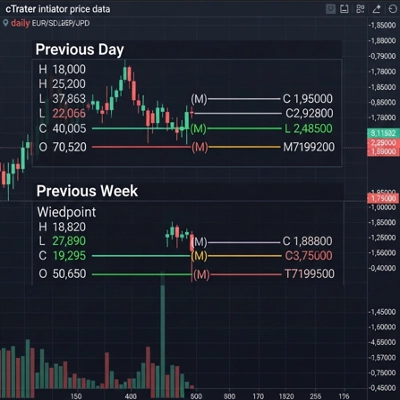
The Weekly Daily Levels indicator shows the OHLC, and mid-point prices for the previous day and week.
مؤشر
EMA
AI-assisted
+1
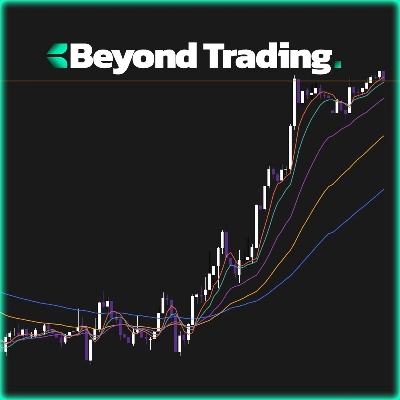
Multi EMA Timeframes lets you stay on your chart and see the exact EMA from any timeframe you choose — up to 5 at once.
مؤشر
cTreder Smart SMA

السعر

منذ 05/09/2025
252.09M
حجم التداول
5.82K
الربح بالبيب
125
التثبيتات المجانية